Analysing trends in the number of listings, listed companies and investment flows
In this note we look at the number of IPO listings, listed companies and investment flows during the Covid-19 pandemic as compared to pre-pandemic times.
Year on year, at the end of Mar-21 the number of listed companies stood at 56,901. Of all listed companies the bulk are domestic (93%) and only 7% are foreign. The number of listed companies grew by +0.73% as compared to March 2020; this increase can be largely attributed to the Americas region, which went up by +4.52% while APAC and EMEA declined by -0.03% and -0.13% respectively.
During the first three quarters of 2020 the number of listed companies decreased as compared to the end of the same quarter the previous year, by -2.80%, -2.37% and -0.86% respectively, only to record a +0.03% uptick at the end of Q4 2020.
Perhaps unsurprisingly, these numbers are largely attributable to domestic companies, accounting for the vast majority of listings. At the end of each quarter of 2020 the number of listed domestic companies fell compared to the same quarter the previous year by -3.04%, -2.46%, -0.96% and -0.29% respectively, though it registered a modest increase of +0.23% at the end of Q1 2021 relative to Q1 2020.
By contrast, compared to the same quarter the previous year, foreign companies went up in all but Q2 2020, by +0.61%, -1.11%, +0.58%, +4.52% respectively. In Q1 2021 the rate of change on Q1 2020 was even higher, at +7.65%.
Quarter on quarter, the first two quarters of 2020 witnessed a decline of -0.58% and -0.06%, which was reversed in Q3 (+0.34%) and continued in Q4 2020 (+0.34%) and Q1 2021 (+0.11%).
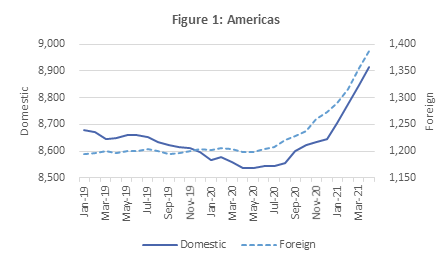
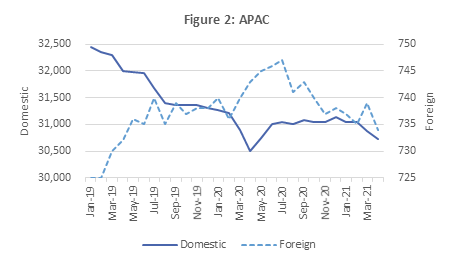
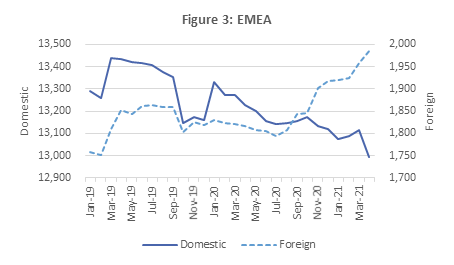
As the regional charts show (Figures 1, 2 and 3), the Americas is the only region where both domestic and foreign companies listed increased in number during the pandemic, while in APAC domestic companies increased and foreign companies went down. EMEA witnessed the opposite situation where domestic companies went down and foreign companies went up.
Before the pandemic listed companies were on a slight down path, while the foreign companies listed in the Americas remained almost constant.
During the pandemic notable is the increase in newly listed domestic companies in the EMEA, while the domestic listed companies in the region is declining.
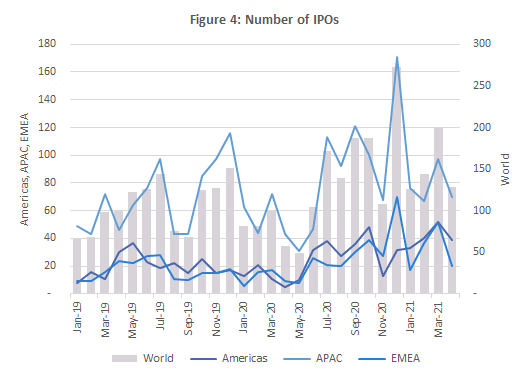
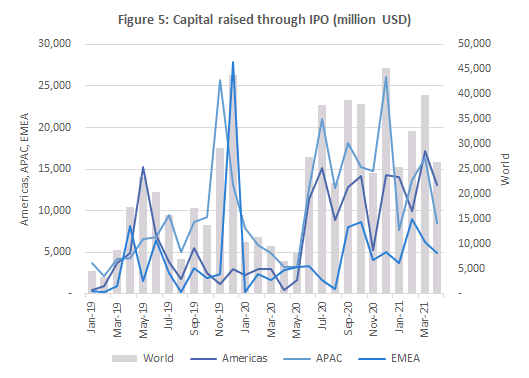
As Figures 4 and 5 show, the number of IPOs and investment flows through IPOs were higher during the pandemic as compared to pre-pandemic times.
The number of IPOs in 2020 reached 1,540 which is a +20.97% increase on the previous year. APAC hosted the most IPOs (63%), followed by EMEA (19%) and the Americas (18%). All regions recorded notable increases compared to 2019: the Americas +20.17%, APAC +16.13% and EMEA +41.67%.
Q2 2020 witnessed a -39.54% decline in the number of IPOs compared to the same quarter the previous year, while Q1 2020, Q3 and Q4 recorded significantly more IPOs, by +12.88%, +72.92% and +40.94% respectively. Q1 2021 witnessed 79.09% more IPOs than Q1 2020.
Quarter on quarter, Q1 2020 recorded a -34.74% decline in the number of IPOs, due to all regions declining. In Q2 the -19.77% decline was due only to APAC region. In Q3 2020 all regions contributed to the 136.02% increase, while in Q4 the 14.06% growth was due to APAC and EMEA. In Q1 2021 the -17.08% was caused by APAC and EMEA.
Investment flows through IPOs in 2020 stood at 280 billion USD, a 36.56% increase on 2019, with the Americas and APAC regions experiencing increases of 83.61% and 47.23% respectively, while EMEA declined by -25.02%. APAC raised the most capital through IPO (52.1%), Americas 33.0% and EMEA 14.9%.
Year on year, only Q2 2020 registered a fall of -31.29% in investment flows through IPOs compared to the same quarter the year before, while Q1, Q3 and Q4 witnessed increases of +87.98%, +146.66% and +23.64% respectively. Q1 2021 recorded 211.68% more investment flows through IPO than the same quarter last year.
Quarter on quarter, in Q1 2020 the capital raised through IPO declined by -63.91%, due to APAC and EMEA, while Q2 experienced an increase in capital raised of 34.11% due to all regions growing. This increase in investment flows continued in Q3 by a notable +135.31%, while Q4 2020 grew by only +8.55% due to APAC and EMEA regions. In Q1 2021 the investment flows fell by -9.02% caused by APAC region.