ETF value traded
In this article, we analyse the trends in ETF value traded in recent years. In order to achieve a more complete view of market activity, the total value traded is split according to the facility / means used to execute the trade, namely Electronic Order Book (EOB), and Negotiated Deals.
The data is available on the WFE Statistics Portal, while the indicators are defined in our Definitions Manual. For questions or feedback about this article, please contact the WFE Statistics Team on [email protected]
In 2021 the total value traded in ETFs across the world was 27.85 trillion USD, which represented a 4.5% increase relative to 2020. This result was due to the Americas and APAC regions which rose 4.9% and 3.6%, respectively, while EMEA fell 1.4%. Most of the value was traded in the Americas region (85%), and only 11% in APAC and 4% in the EMEA (Figure 1).
Figure 1: ETF total value traded between Jan 2020 – Jul 2022
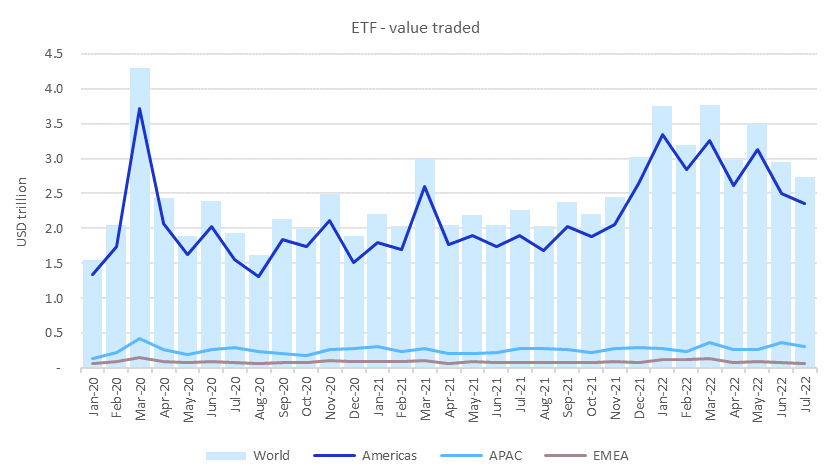
In H1 2022, the amount of ETF value traded rose 40.4% compared to the previous six-months period, amounting to 20.13 trillion USD. All regions increased: the Americas 45.2%, APAC 9.4% and EMEA 24.7%.
When comparing H1 2022 with H1 2021, we notice an even more pronounced increase of 49%, due to all regions experiencing an increase in activity: the Americas 53.9%, APAC 21.9% and EMEA region 18.6%.
The exchanges with the highest value traded in ETF year-to-date (Jan - Jul 2022) were: Nasdaq-US (14.36 trillion USD), Shanghai Stock Exchange (836.26 billion USD), Japan Exchange Group (339.91 billion USD), Korea Exchange (321.15 billion USD) and Hong Kong Exchanges and Clearing (209.91 billion USD).
In Q2 2022 the amount of ETF value traded decreased 12.1% compared to the previous quarter, amounting to 9.42 trillion USD, with the Americas and EMEA regions experiencing sharp declines of 12.6% and 30.1%, respectively, while APAC region had a 0.6% uptick.
When comparing Q2 2022 with Q2 2021, a 49.8% increase is noticed, with all regions having contributed to this result: the Americas increased 52.7%, APAC 41% and EMEA 7.9%.
The ETF total value traded by region is illustrated in Figures 2-4. We notice that all regions recorded their highest value traded in March 2020, a month in which we saw spikes in market volatility.
Figure 2: ETF total value traded between Jan 2020 – Jul 2022 in the Americas region
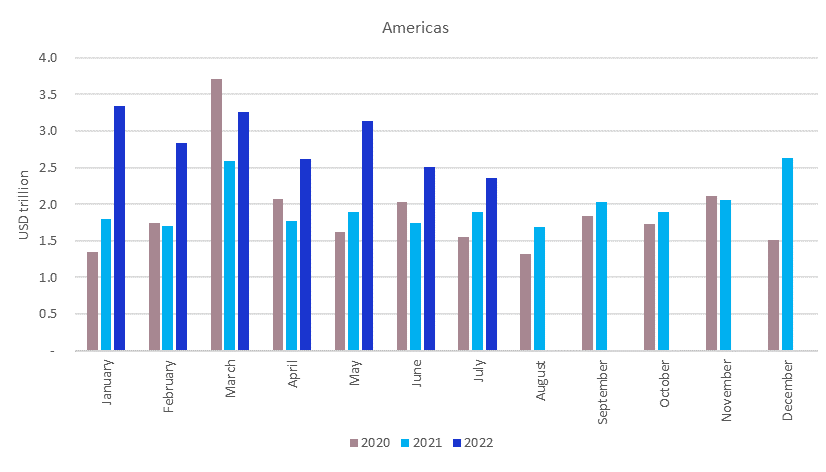
Figure 3: ETF total value traded between Jan 2020 – Jul 2022 in the APAC region
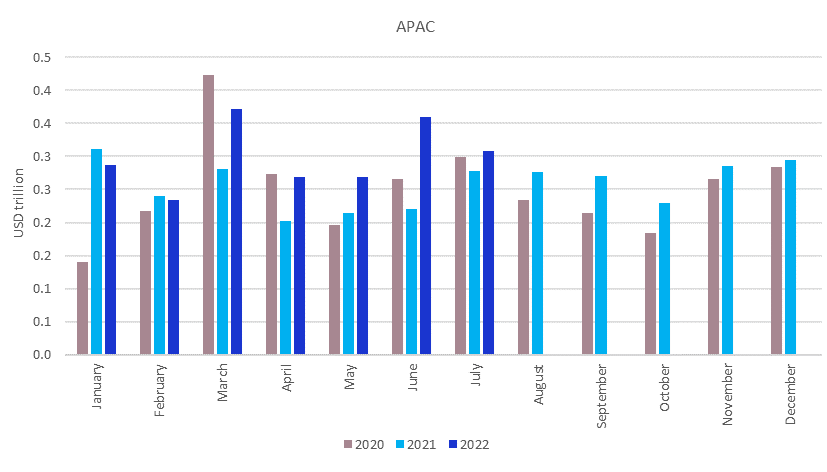
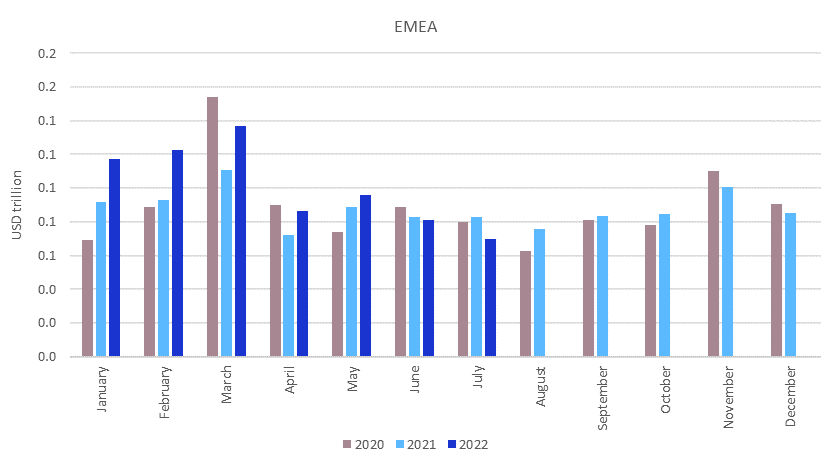
Figure 4: ETF total value traded between Jan 2020 – Jul 2022 in the EMEA region
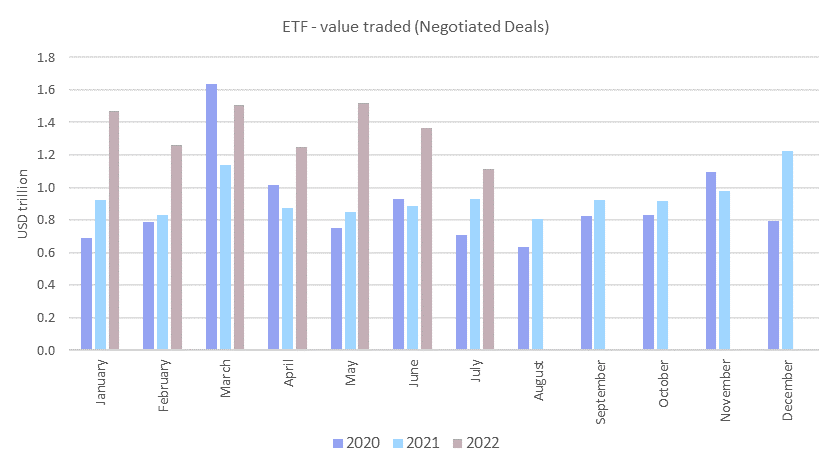
With regards to the split between EOB and negotiated deals, year-to-date (Jan-Jul 2022) there were 13.34 trillion USD traded through EOB (58% share) and 9.50 trillion USD traded through negotiated deals (42% share). From Figure 5 we notice that value traded through negotiated deals follows the same pattern (with very few exceptions) as through EOB.
Figures 6 - 7 present the evolution of value traded EOB and negotiated deals between Jan 2020 – Jul 2022. Please note that the total value traded is sometimes higher than the sum of the value traded (EOB) and negotiated deals as some exchanges cannot provide the breakdown.
Figure 5: ETF value traded EOB and negotiated deals between Jan 2020 – Jul 2022
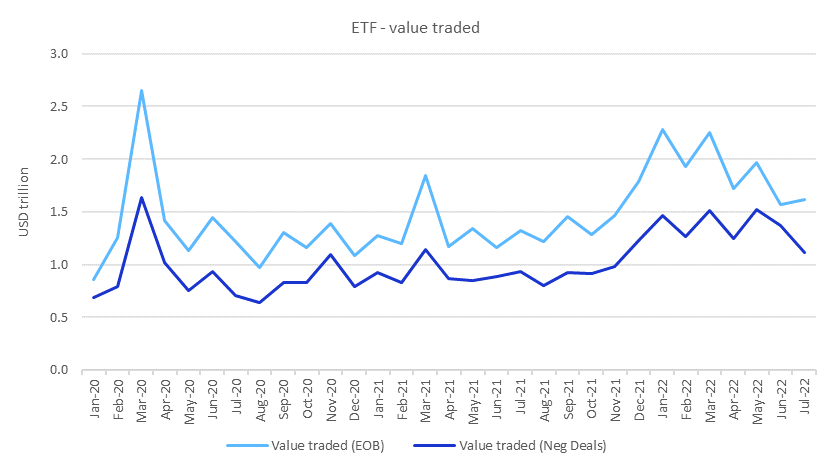
Figure 6: ETF value traded EOB between Jan 2020 – Jul 2022
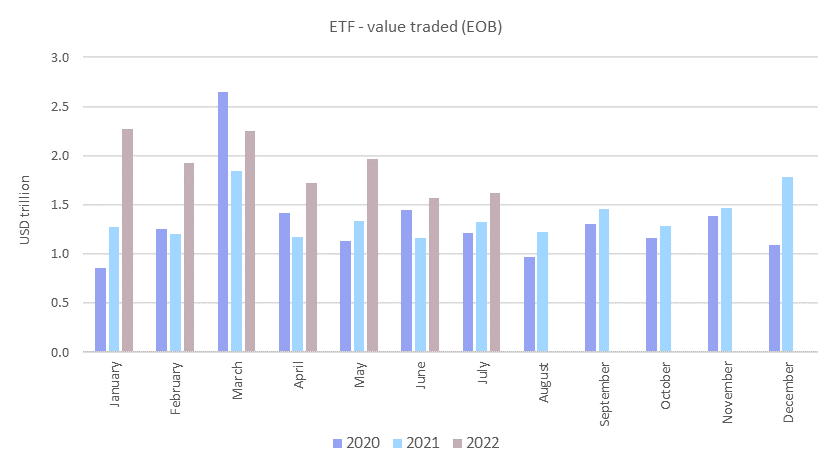
Figure 7: ETF value traded negotiated deals between Jan 2020 – Jul 2022