Green bonds
In this article, we analyse the trends in exchange-traded green bonds observed in the last year. The data is available on the WFE Statistics Portal, while the indicators are defined in our Definitions Manual. For questions or feedback about this article, please contact the WFE Statistics Team at [email protected]
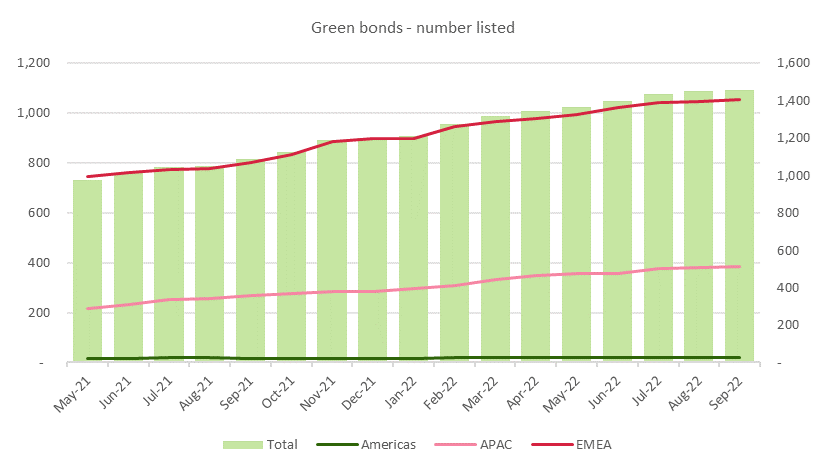
The number of green bonds listed on the world markets in Q3 2022 reached 1,458, which represents a 4.2% increase on Q2 2022 (QoQ) and 34.3% increase on Q3 2021 (YoY) as seen in Figure 1.
Most green bonds are listed in the EMEA region (72.3%), followed by APAC (26.4%), while the Americas region accounts only for 1.3%.
QoQ: APAC and EMEA regions listed more green bonds by 7.5% and 3.1%, respectively, while the Americas remained constant.
YoY: the number of listed green bonds increased in all regions: the Americas (11.8%), APAC (44.2%) and the EMEA region (31.4%).
Figure 1: Number of green bonds listed by region between May 2021 and September 2022
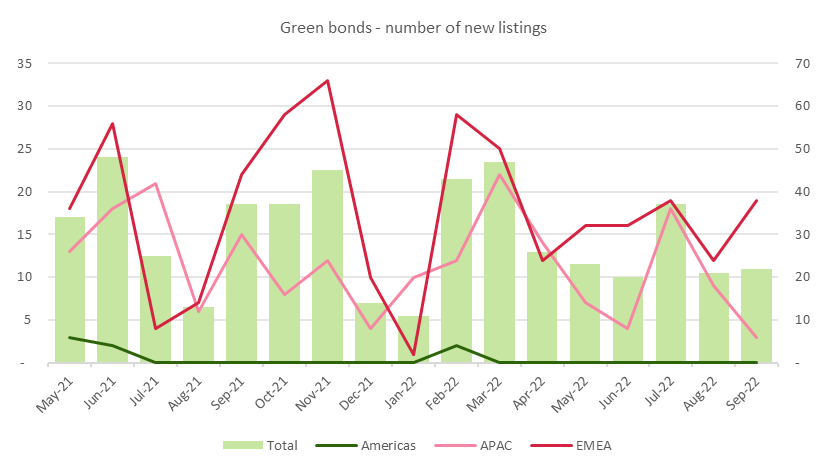
With regards to green bonds new listings, Q3 2022 recorded a 15.9% increase compared to the previous quarter, amounting to 80, with APAC and EMEA regions going up 20% and 13.6%, respectively. There were no new listings in the Americas region in Q2 and Q3 2022.
Most of the green bonds new listings took place in EMEA (62.5%), with APAC accounting for the rest (37.5%) (Figure 3).
YoY: the increase was only 6.7%. While new listings in EMEA went up 51.5%, in APAC they declined 28.6%.
It is worth noting that the number of bond new listings fell in Q3 2022 when compared to the previous quarter (20.2%) and YoY (31.4%), with only the Americas region registering a YoY increase of 26.8%.
Figure 2: Bonds and green bonds new listings between May 2021 and September 2022
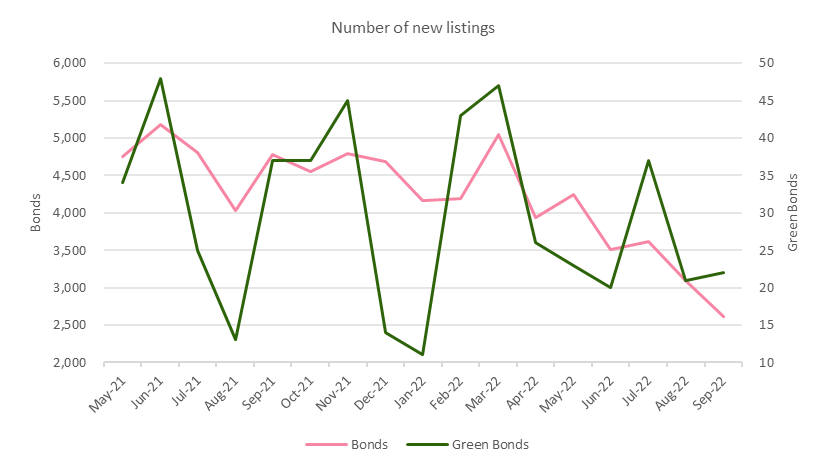
Figure 3: Green bonds new listings by region between May 2021 and September 2022
Regarding green bonds value traded, this amounted to 4.8 billion USD in Q3 2022, representing a 84.3% increase QoQ, result due to APAC and EMEA regions, which grew 14.3% and 535.3%, respectively. There was no green bond trading in the Americas region in Q2 and Q3 2022.
53.7% of the value is traded on APAC markets, while EMEA accounts for 46.3% (Figure 4).
YoY: we notice a 67.9% decline due to EMEA falling 83.6%, while APAC went up 83.1%.
Figure 4: Green bonds value traded by region between May 2021 and September 2022
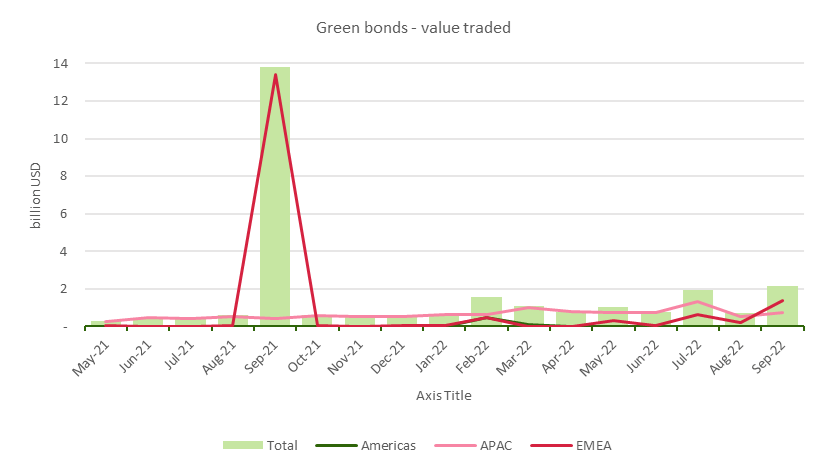
The EMEA peak recorded in September 2021 is due to the exceptional performance of the London Stock Exchange.
Capital raised by green bonds declined 27.9% in Q3 2022 compared to the previous quarter, amounting to 44.4 billion USD, with all regions falling: the Americas 9%, APAC 10.8% and EMEA 30.1%.
87% of the capital is raised in EMEA markets, 9.1% in markets in the Americas region and the rest of 3.9% in APAC markets (as shown in Figure 5).
YoY: the capital raised registered a 41.7% increase, due to the Americas (1.9%) and EMEA regions (62.7%), while APAC declined (52.3%).
Figure 5: Green bonds capital raised by region between May 2021 and September 2022
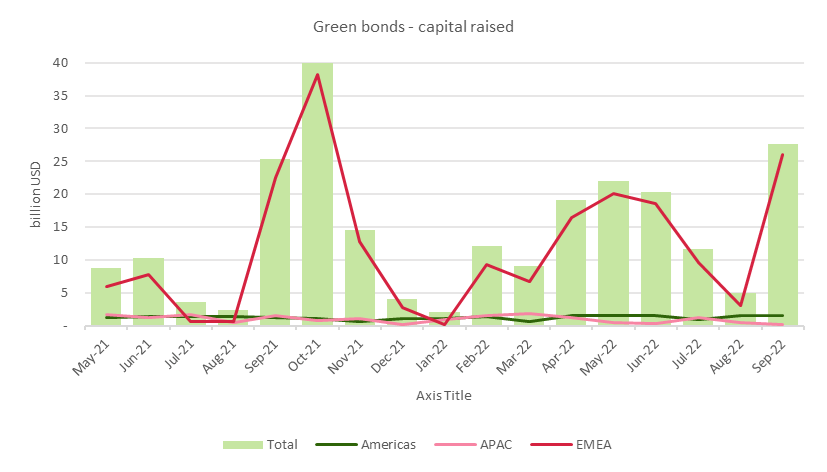
The peak in EMEA in October 2021 is due mostly to Luxemburg Stock Exchange and London Stock Exchange.