An introduction to the WFE’s Statistics Advisory Group (SAG)
Frank Hatheway, Nasdaq Chief Economist, and Marc Berthoud, Executive Director, Head Data Strategy at SIX Group share some thoughts on the role of SAG.
The WFE’s statistics database is a core resource, used by academics, private sector enterprises, regulators and exchanges themselves.
Over 13,000 people subscribe to the WFE’s monthly statistical reports. The value of the data lies not just in the scope of coverage but also in the consistency and comparability of the data. This consistency and comparability exists because all data is reported according to agreed definitions.
The WFE’s Statistics Advisory Group (SAG) plays a critical role in this regard. Frank Hatheway, Nasdaq Chief Economist, and Marc Berthoud, Executive Director, Head Data Strategy at SIX Group currently serve as Chair and Vice-Chair of the SAG respectively. They shared some thoughts on the role of SAG and the WFE’s indicators.
What is the SAG, and why is its role in the WFE so important?
The SAG is made up of statistical experts from WFE member exchanges that work with the WFE staff on issues related to the collection, consistency, use, and dissemination of statistical information. Statistics are one of the tools the WFE uses to show to our many global stakeholders the role played by WFE exchanges in the world economy. WFE statistics have a long-standing position as the gold standard for information about global exchange activity. The ultimate goal of the SAG is to see that WFE statistics continue to be the most valued source of exchange information.
In addition to advising the WFE membership on definitions, the SAG also subjects the WFE statistics to continual scrutiny to ensure WFE statistics adapt to changing environments and thereby remain consistent, relevant and accurate. The types of securities that exchanges list and trade change over time, as do the interests of global stakeholders. The SAG provides the membership with a broad-based view of WFE statistics by combining the expertise and perspective of the WFE staff with the expertise and perspective of the member exchanges.
Have there been any new indicators implemented over the past few years that have been particularly interesting?
One of the consequences of the 2008-2009 global financial crisis was the recognition that access to liquidity is an important component of financial stability. During the crisis, the performance of exchanges in providing access to liquidity was notably superior to that of other sources of liquidity. The Working Committee recently approved a SAG recommendation that the WFE collect and disseminate a new Liquidity Indicator to provide stakeholders with information about the state of exchange liquidity in listed equities.
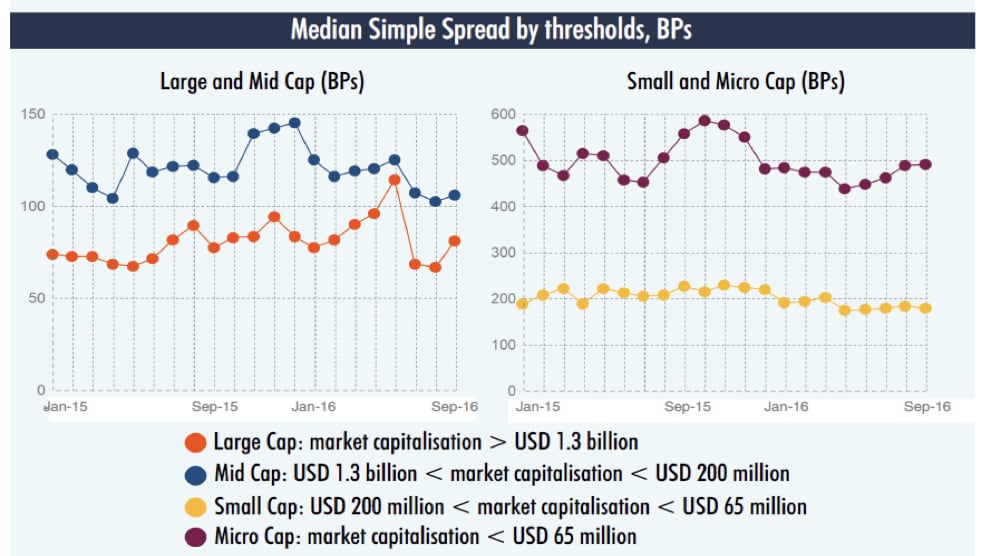
Marc Berthoud led the SAG’s work in designing the Liquidity Indicator. The indicator gives users more nuanced insights into liquidity which can be tailored by region, size of exchange, or size of listed company as desired. Stakeholders and WFE members themselves can observe how liquidity is affected by market events, exchange innovations, or long term trends. The Liquidity Indicator is currently being rolled out by the WFE and will be a valuable tool for WFE members, system risk regulators, and other WFE stakeholders once fully incorporated into the WFE statistics.
Linking back to the real economy, the WFE also collects information about company IPOs and investment flows. This provides valuable insight to financing across WFE membership.
What’s the rationale for the WFE publishing its own set of indicators?
The WFE is neutral, standard and comprehensive. It is able to source the data directly from its membership. The WFE can rely on the expertise of the data specialists of the local markets while ensuring consistency through the use of agreed definitions. This allows the WFE to present the information in a way that allows stakeholders to understand trends in the exchange industry, both global and local.