Market data: challenges and opportunities for market infrastructures
Anton Govor, Head of Strategy, MOEX, takes us through how Big Data and AI could be applied to financial infrastructures.
Overview
Data business is claimed to be the ‘new oil’ for the financial industry, and financial infrastructures in particular are one of the largest repositories of data for financial markets. Big Data and Artificial Intelligence (AI) have already become buzz words. However, what are the specific applications of Big Data and AI for financial infrastructures and their data? In this article, we would like to share Moscow Exchange's (MOEX) experience in this journey over the past year.
- We explore a simple innovative data product prototype developed by MOEX in cooperation with Datalogia, a Russian based startup data company, based on applying data science techniques to the exchange’s own unique data sets.
- Even simple trade log enrichment allows the creation of highly marginal products for the buy-side, and could be used by exchanges for incremental revenue generation.
- Global unification and standardisation of these type of products would be beneficial for both exchanges and global buy-side investors.
Product prototype description
The idea for the product stemmed from a classical sell-side customer flow analysis conducted by banks’ in-house research teams on a daily basis, based on the flow they see from their clients.
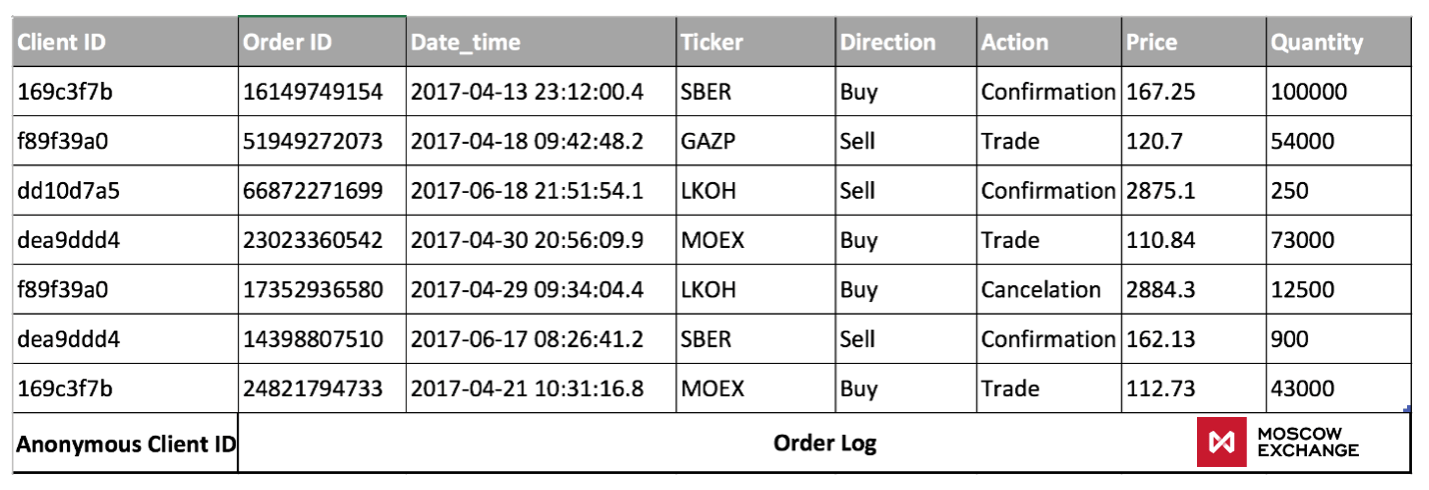
In partnership with Datalogia, we revisited this concept based on MOEX data sets. To build the prototype product we utilised plain daily trading logs enriched with unique anonymous client identifications (see pic.1) and applied various machine learning techniques and customer behaviour analytics to this dataset, to develop client clusters using more than 70 engineered client features.
Picture 1. Sample MOEX data set utilised
Identified client clusters were then grouped to a level when they could not be disaggregated backwards to identify individual trading patterns.
For each of these client groups, the simple net flow figure (total buy minus total sell for all clients in a cluster) was calculated. This indicator for just four clusters (namely retail, high frequency traders, large institutionals and others) proved to contain highly valuable information for the buy-side investor, and may be seen as an alternative high-quality flow research provided by exchanges.
Picture 2. Illustrative net flow decomposition for a sample group
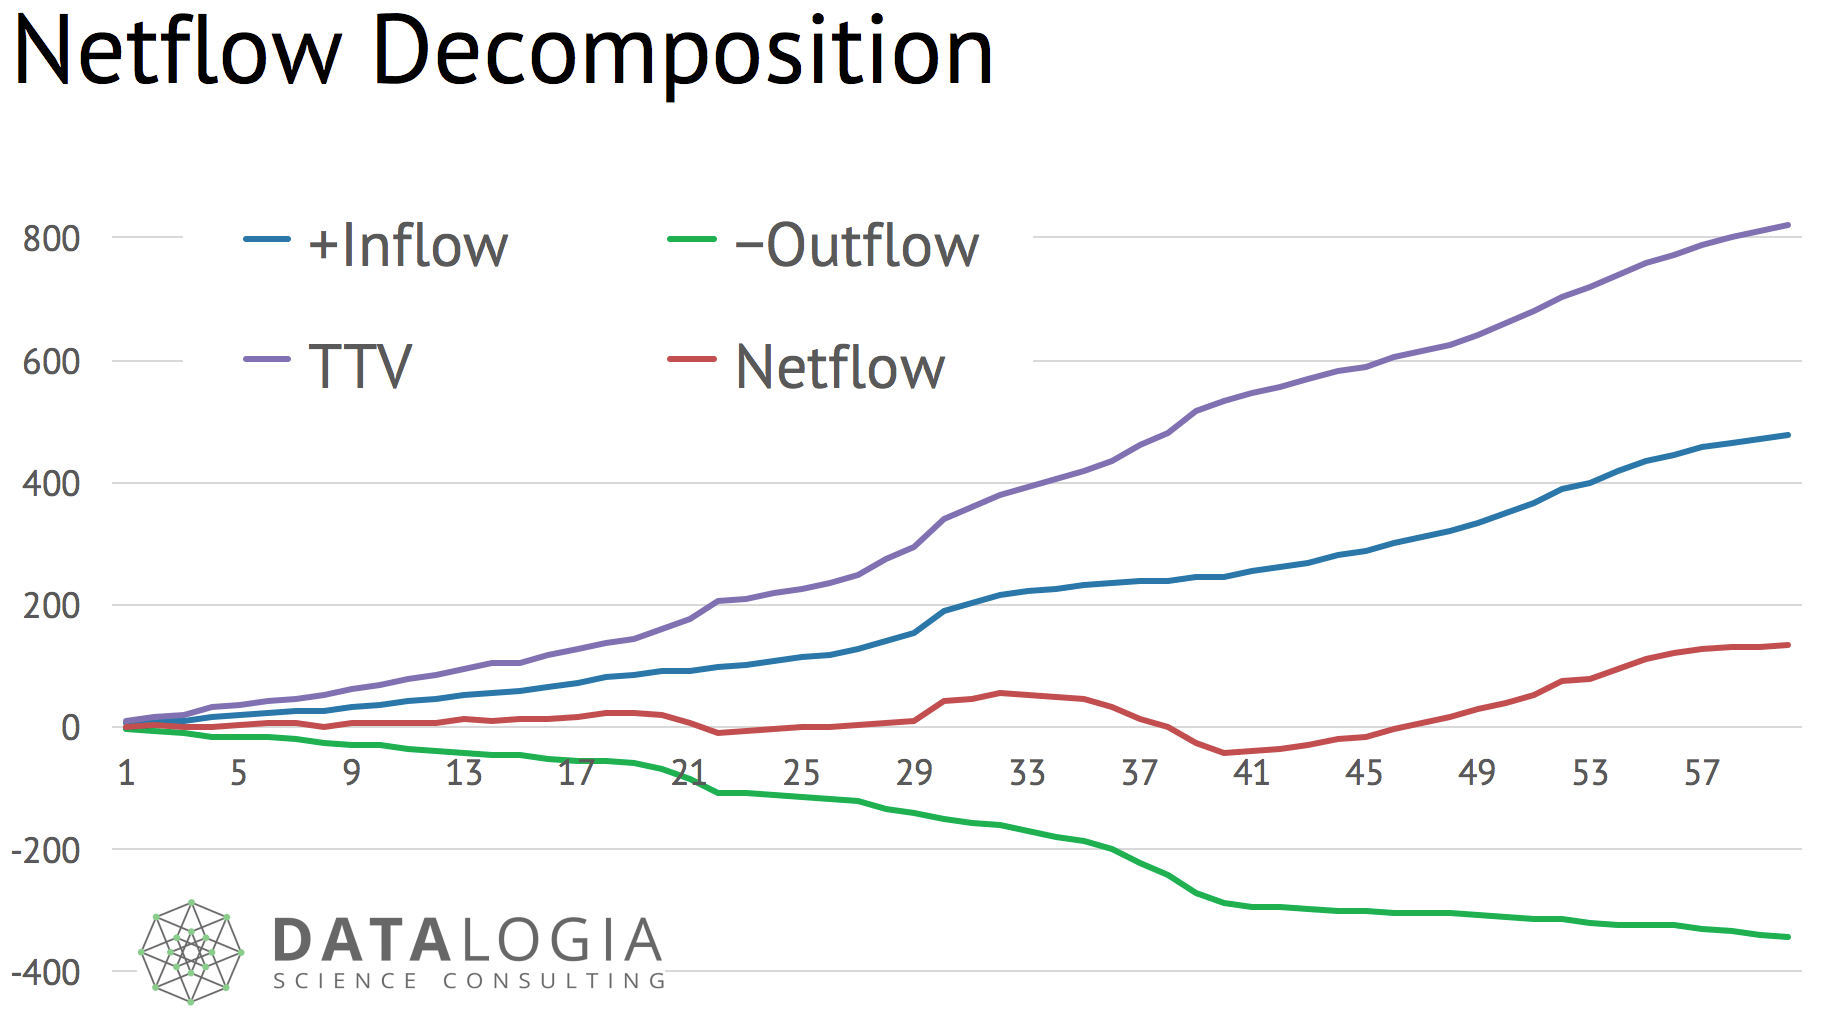
*TTV - total traded volume
Summary
Order flow research requires access to full order log information, and thus is accessible only to the owners of order log data, i.e. exchanges themselves.
Net flow indicators may be utilised by investors as a high quality alpha source, and can show uncorrelated performance with traditional alphas based on price action or fundamental data.
Order flow research benefits both the exchanges and investors. Exchanges are benefitting directly from a revenue stream generated by such products, and indirectly from increased commission revenue from growing trading activity. Funds are benefitting in turn from access to a new source of alpha.
We see such data products as ‘new collocation’ services which may be provided by exchanges. Trading latency has been exchange business for at least last 10 years, and we see exchange-data enabled research products coming next.
Based on initial feedback on the product from both local and international clients, we believe that the full potential of such products could be unlocked once a substantial number of exchanges implements similar methodologies and data techniques to its data sets worldwide, allowing global hedge funds to allocate capital for such strategies across different geographies. This homogeneity could create significant value to the product users, as they would be able to apply similar strategies in different places.