Market liquidity during the coronavirus pandemic
The coronavirus pandemic heavily hit financial markets worldwide. During March 2020, at the peak of the European crisis, global market capitalisation fell by 9.2% compared to March 2019. Volatility reached record high levels, with circuit breakers being triggered on multiple occasions across jurisdictions on all continents. Extreme measures with no benefits for capital markets, such as exchange closures and short-selling bans, entered into the policy agendas in several places. Financial markets proved however to be resilient, and volatility came back to normal levels in April 2020.
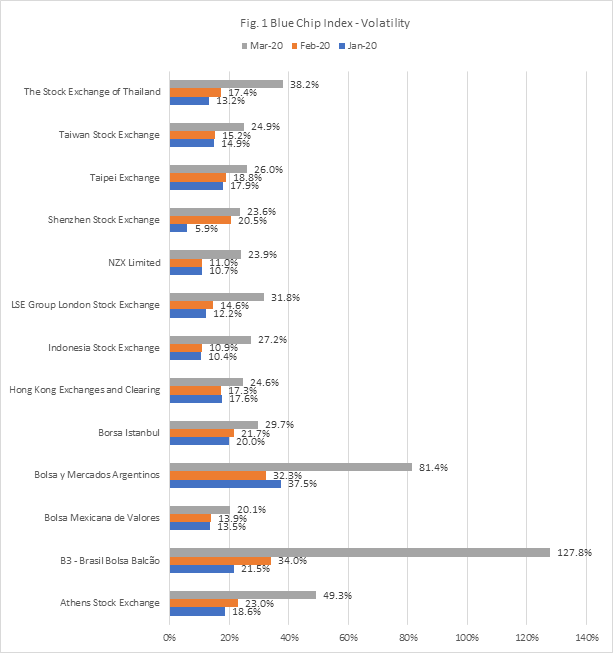
As Fig. 1 shows, Blue Chip Index - Volatility increased significantly in Mar 2020. B3 - Brasil Bolsa Balcão’s index increased from February to March by 275.6%, Bolsa y Mercados Argentinos by 151.8%, Indonesia Stock Exchange by 150%, while Shenzhen Stock Exchange increased by only 14.8%.
During such a period of intense turmoil, one would expect stock market liquidity to dry up. In this note we assess whether it is the case. In more detail, we examine the performance of a WFE liquidity measure, the Median Simple Spread (MSS), during the first half of 2020, when the Covid-19 pandemic took hold. We compare it with the same period of the previous year to see if there are any meaningful differences or patterns to emphasise. This note extends the results of the WFE Q1 markets highlights report.
The median simple spread (MSS) is a liquidity measure calculated using bid/ask spreads. The MSS is denominated in basis points (Bps). MSS is calculated and presented per market segment as follows:
• Large cap: market cap > USD 1.3 bn
• Mid cap: USD 1.3 bn > market cap > USD 200 m
• Small cap: USD 200 m > market cap > USD 65 m
• Micro cap: market cap < USD 65 m
Larger markets also split the Large Cap segment into quartiles and provide MSS data for each of the Large cap quartiles. For further information on how MSS is calculated we invite the reader to consult our Definition Manual
The analysis of this note based on MSS data received from WFE member exchanges over the Jan 2019 to May 2020 period, which can be found in the annex.
Looking at market data in the beginning of 2020, we notice that the market liquidity increased in some market segments and decreased in others across the three regions. In February 2020, however, when the COVID-19 crisis started hitting financial markets, spreads started increasing more or less consistently across market segments/regions. In March 2020, during the worst days of the pandemic, we observe an increase in MSS, which implies a widening of spreads and lower liquidity, across all regions/segments. The month-on-month change in APAC, Americas and EMEA regions is shown in Tables 1-3.
|
Table 1 Median Simple Spread month on month change in APAC region |
||||
|
Indicator |
%change Jan-20/Dec-19 |
%change Feb-20/Jan-20 |
%change Mar-20/Feb-20 |
|
|
Large Cap / Top Quartile |
-0.3% |
0.2% |
1.3% |
|
|
Large Cap / Second Quartile |
-17.2% |
22.8% |
0.9% |
|
|
Large Cap / Third Quartile |
-2.2% |
3.8% |
0.5% |
|
|
Large Cap / Lowest Quartile |
-10.1% |
9.9% |
0.8% |
|
|
Large Cap |
-5.0% |
5.7% |
1.4% |
|
|
Mid Cap |
-1.0% |
10.5% |
21.7% |
|
|
Small Cap |
-0.6% |
6.8% |
30.3% |
|
|
Micro Cap |
-19.5% |
11.9% |
47.9% |
|
|
Table 2 Median Simple Spread month on month change in Americas region |
||||
|
Indicator |
%change Jan-20/Dec-19 |
%change Feb-20/Jan-20 |
%change Mar-20/Feb-20 |
|
|
Large Cap / Top Quartile |
7.2% |
-4.9% |
54.1% |
|
|
Large Cap / Second Quartile |
5.0% |
5.3% |
32.4% |
|
|
Large Cap / Third Quartile |
7.4% |
-7.2% |
117.7% |
|
|
Large Cap / Lowest Quartile |
-5.6% |
33.9% |
75.9% |
|
|
Large Cap |
7.3% |
-0.9% |
91.0% |
|
|
Mid Cap |
-7.5% |
4.3% |
74.6% |
|
|
Small Cap |
-3.3% |
13.9% |
27.7% |
|
|
Micro Cap |
-3.0% |
18.8% |
35.7% |
|
|
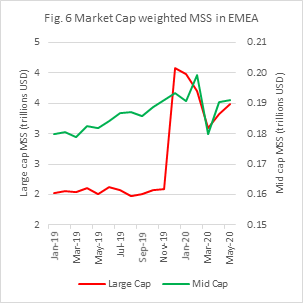
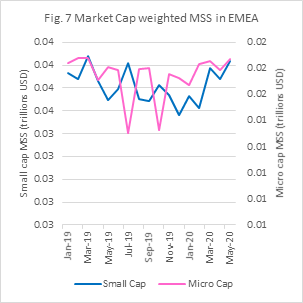
Table 3 Median Simple Spread month on month change in EMEA region |
||||
|
Indicator |
%change Jan-20/Dec-19 |
%change Feb-20/Jan-20 |
%change Mar-20/Feb-20 |
|
|
Large Cap / Top Quartile |
-25.3% |
53.6% |
31.7% |
|
|
Large Cap / Second Quartile |
-41.0% |
111.8% |
38.6% |
|
|
Large Cap / Third Quartile |
-46.0% |
142.7% |
197.4% |
|
|
Large Cap / Lowest Quartile |
30.9% |
-55.5% |
54.6% |
|
|
Large Cap |
-9.0% |
-28.4% |
54.0% |
|
|
Mid Cap |
21.2% |
6.6% |
39.4% |
|
|
Small Cap |
37.2% |
-26.4% |
26.7% |
|
|
Micro Cap |
-22.2% |
-2.1% |
52.3% |
|
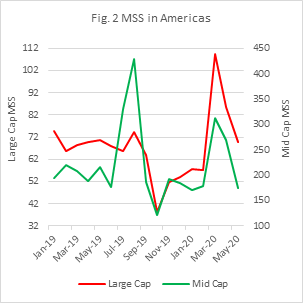
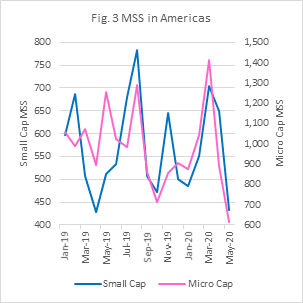
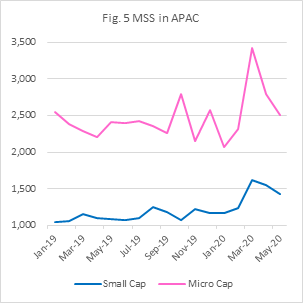
Fig. 2 – 7 show the MSS in the three regions from Jan 2019 to May 2020. The decrease in May 2020 of MSS across the three regions suggests the narrowing of the gap between the bid and ask price and increasing market liquidity.
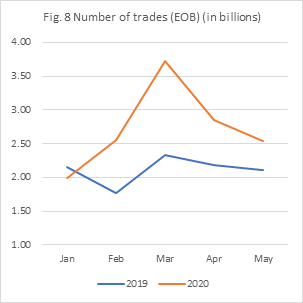
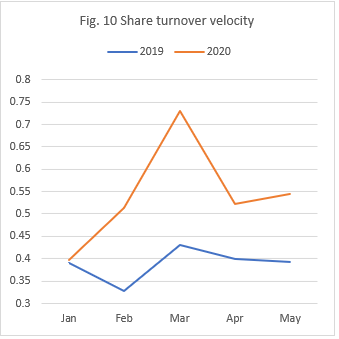
Alongside the increase in spreads, we also notice that the number of trades and the traded value is higher in 2020 than in the same period in 2019, suggesting the presence of sell-offs on stock exchanges worldwide. If in 2019 the %change value traded Mar/Feb was up 29.2%, in 2020 it was up 41.9%. While the %change number of trades increased by 31.8% in Mar 2019, but 46.1% in Mar 2020. Turnover velocity also increased by 69.4% as shown in Fig. 10. This finding shows how trade measures of liquidity should be evaluated together with spread measures of liquidity to have a complete picture of how liquidity behaves in a market.
Annex 1: Exchanges who provided data for this analysis
Americas
B3 - Brasil Bolsa Balcão
Bolsa de Valores de Lima
Bolsa Mexicana de Valores
Nasdaq - US
Asia - Pacific
ASX Australian Securities Exchange
Bursa Malaysia
Hochiminh Stock Exchange
Korea Exchange
National Stock Exchange of India
NZX Limited
Shenzhen Stock Exchange
Taipei Exchange
Taiwan Stock Exchange
The Stock Exchange of Thailand
Europe - Africa - Middle East
Amman Stock Exchange
Athens Stock Exchange
BME Spanish Exchanges
Cyprus Stock Exchange
Luxembourg Stock Exchange
Moscow Exchange
Palestine Exchange
Saudi Stock Exchange (Tadawul)
Tel-Aviv Stock Exchange
The Egyptian Exchange