Median Simple Spreads in 2018
At the beginning of FebruaryY 2019, the WFE published its 2018 Full-Year Market Highlights, analysing various metrics of market activity. A key trend in 2018, was the return of volatility, breaking the spell of stable markets in 2017. As an extension of the analysis in the market highlights, in this report, we examine the performance of another WFE indicator – the Median Simple Spread (MSS). The analysis is based on MSS data received from WFE member exchanges over the Jan 2017 to Dec 2018 period.
The WFE has been collecting data on a new indicator of markt liquidity, the Median Simple Spread, since Jan 2015. The MSS seeks to complement another WFE liquidity indictor, Turnover Velocity, a post-trade liquidity indicator showing value of share trading as a proportion of market capitalisation. The MSS is a pre-trade indicator reflecting differences in bids and asks over time. Median Simple Spreads are reported at a more granular level (for market segments on an exchange, classifying companies based on their market capitalisation) than Turnover Velocity and are particularly insightful during periods of high market activity.
Median Simple Spreads by company segment
We begin by looking at global MSS trends over 2017 and 2018, split by size of company. Thus, the companies on each market were divided into four-segments namely Large cap, Mid Cap, Small cap and Micro cap depending upon their market capitalisation. In order to ensure that a few small relatively illiquid markets do not influence the overall trend in the average MSS, the spreads of each market segment of an exchange have been weighted by its share of the overall (sum across all markets) market capitalisation of that segment in that month.
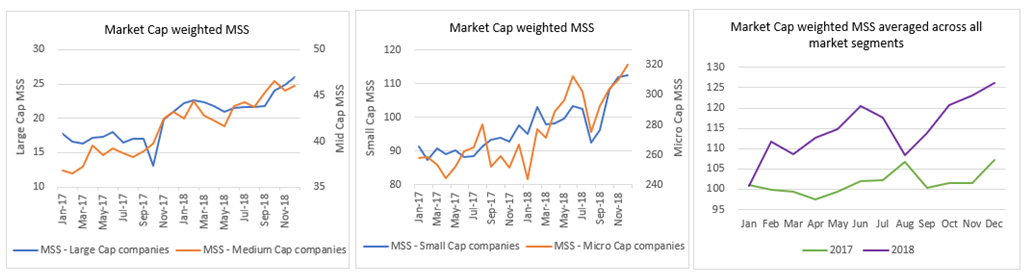
- What is clear from the data is that while the 2018 period was characterised by much higher trading activity than 2017 (the global value and volume of trades in equity shares were up 15.4% and 11.5% on 2017), the uncertainty of that period seems to be reflected in wider spreads.
- This is the case across all market segments. For large cap companies, the spreads peaked in December 2018 at 26.03bps as compared to a peak of 20.91bps in December 2017.
- At the overall level (not split out by market segments) spreads peaked at 126.15bps in December 2018, as compared to 107.12 in December 2017.
- The largest difference in the average MSS in 2018 compared to the corresponding month in 2017 was in Nov (+21.1%) followed by Oct (+19%).
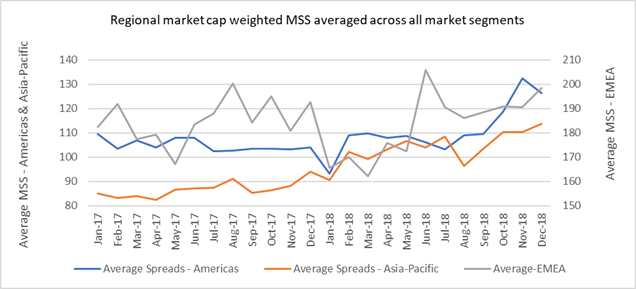
Median Simple Spreads by region
We also examine MSS trends broken out by region. To do this, we weighted the MSS by the segment-wise total market capitalisation at a regional level. We then compared the simple average of the MSS across the four market segments for each region over the Jan 2017 – Dec 2018 period.
- As noted, 2018 volumes and value of trades in equity shares were up on 2017, while overall market capitalisation was down 14.9% on 2017. Looking at this regionally:
- Value traded: Americas region (+30.4%), EMEA region (+11.1%), Asia-Pacific (-3.6%)
- Volume traded: Americas region (+19.4%), the Asia-Pacific region (+ 7.9%), EMEA (+10%)
- Domestic Market Capitalisation: Americas region (- 6.3%), Asia-Pacific (-23.8%), EMEA region (-16.5%)
- Overall, average spreads widened across all regions over most of Q3 and Q4 2018. While in the Americas region and the Asia-Pacific region, the spreads in most months (ten and twelve months respectively) of 2018 were larger than corresponding months in 2017, the EMEA region saw wider spreads in six out of twelve months of 2017 over 2018.
- For the Americas the spread peaked in November 2018 at 132.3bps (as compared to the January 2017 peak of 109.6); in the Asia-Pacific region the spread peaked at 113.7bps in December 2018 versus 94bps in 2017. Overall, spreads in the EMEA region are consistently higher than those in the Americas and Asia-Pacific regions, with generally higher variability. In the EMEA region the largest spread was in June 2018 at 205.7bps as compared to 200.4bps in August 2017.
- The trends observed in the average MSS at the regional level were not always the same at the market segment level within the region. While in the Large cap segment, the weighted MSS in Q4 2018 were notably higher than the rest of the year in all three regions, this was not the case in the Small and Micro cap segments where some markets saw spreads narrow in Q4 2018.We also examine MSS trends broken out by region. To do this, we weighted the MSS by the segment-wise total market capitalisation at a regional level. We then compared the simple average of the MSS across the four market segments for each region over the Jan 2017 – Dec 2018 period.