Number of IPOs
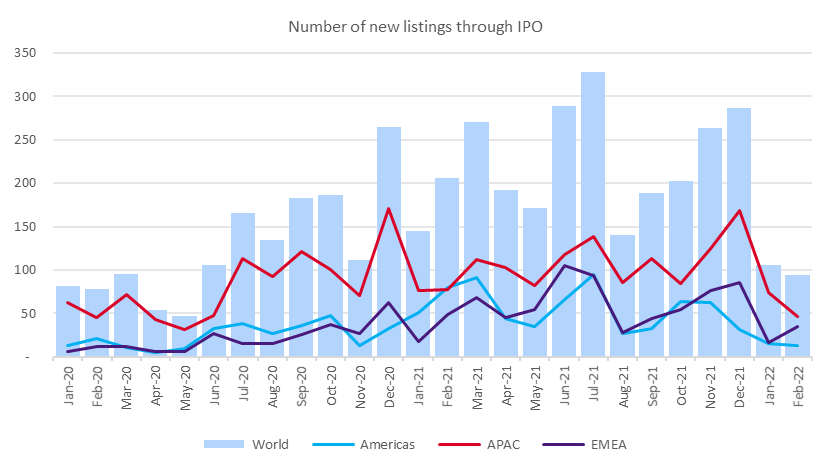
In this article, we analyse the trend in the number of new listings through IPO in 2021 compared to 2020.
The data is taken from the WFE Statistics Portal. The definition of our indicators can be found in WFE Definitions Manual.
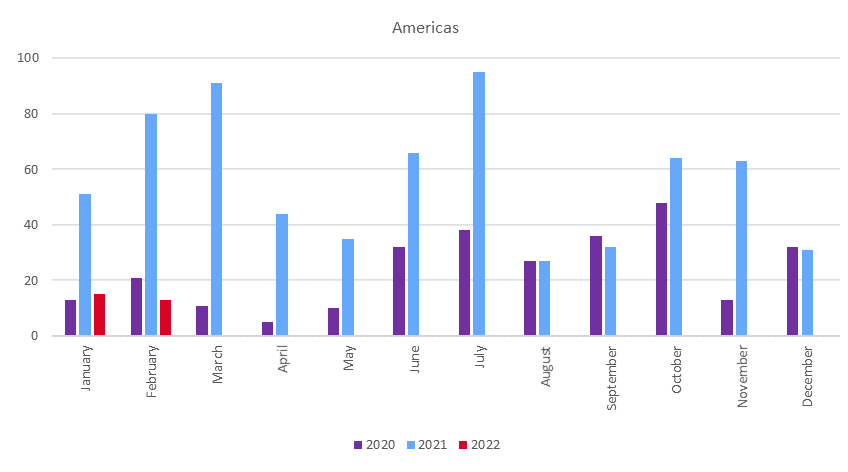
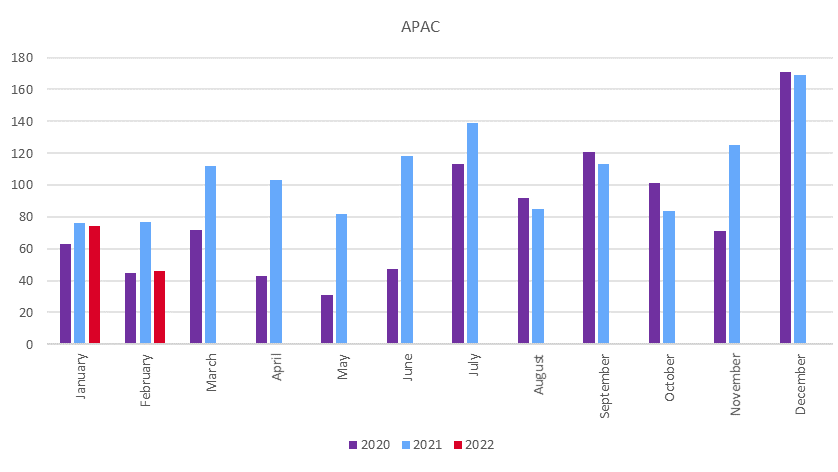
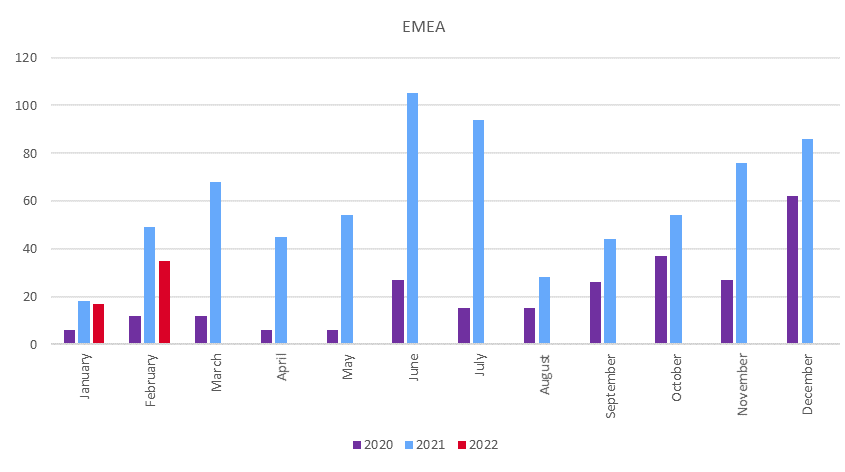
In 2021 there were 2,683 new listings through IPO, which represented a 178% increase on 2020. This result was due to all regions experiencing increased activity: the Americas 237.4%, APAC 132.3% and EMEA 287.3%.
The majority of IPOs took place in the APAC markets (48%), 27% in EMEA and the rest (25%) in the Americas region.
Moreover, 1,409 IPOs were listed in H2 2021, 10.6% more than H1 2021. This result was due to the APAC and EMEA regions increasing 25.9% and 12.7%, respectively, while the Americas registered 15% fewer IPOs compared with the first half of the year.
When comparing H2 2021 with H2 2020, the number of IPOs rose 34.8%, with all regions going up: the Americas 60%, APAC 6.9% and EMEA more than doubling (109.9%).
Figure 1: Number of IPOs between Jan 2020 – Feb 2022

In Q4 2021 the number of IPOs increased 14.5% compared to Q3 2021, amounting to 752, which is the quarter with the highest number of IPOs in the last two years. All regions contributed to this result, the Americas went up 2.6%, APAC 12.2% and EMEA 30.1%.
The top three exchanges that grew the most were: Colombo Stock Exchange (800%), TMX Group (366.7%) and Singapore Exchange (300%). The top three exchanges with most IPOs listed were: NYSE (71 IPOs), ASX Australian Securities Exchange (70 IPOs) and Nasdaq Nordic and Baltics (63 IPOs).
When comparing Q4 2021 with Q4 2020, the increase is more pronounced (33.8%). This performance was due to all regions: the Americas increased 69.9%, APAC 10.2% and EMEA region 71.4%.
The regional number of IPOs is illustrated in Figures 2-4.
Figure 2: Number of IPOs between Jan 2020 – Feb 2022 in the Americas region

Figure 3: Number of IPOs between Jan 2020 – Feb 2022 in the APAC region

Figure 4: Number of IPOs between Jan 2020 – Feb 2022 in the EMEA region
