REITs trends
In this article, we analyse the trends in real estate investment trusts (REITs) observed over the past three years, specifically their market capitalisation and number of listings. The market capitalisation is calculated as the total number of REITs units multiplied by their respective closing prices (or NAVs) at the end of the month.
The data is available on the WFE Statistics Portal, while the indicators are defined in our Definitions Manual. For questions or feedback about this article, please contact the WFE Statistics Team at [email protected]
At the end of 2024 there were 491 listed REITs on the world’s markets. This represents 7.2% increase on 2023. This result was due to the APAC and EMEA markets rising 15.8% and 1.9%, respectively, while the Americas region declined 2.1%.
48% of REITs are listed on APAC markets, while the Americas and EMEA regions account for 19% and 33%, respectively.
At the end of Q4 2024 the number of listings rose 2.7% compared to Q3 2024, observing the same regional trend: the APAC and EMEA regions increased 5.4% and 1.2%, respectively, while the Americas region declined 1.1%.
Figures 1 – 4 show the number of listed REITs by region between January 2022 and December 2024.
Figure 1: Number of listed REITs between January 2022 - December 2024

Figure 2: Number of listed REITs in the Americas region between January 2022 - December 2024

Figure 3: Number of listed REITs in the APAC region between January 2022 - December 2024
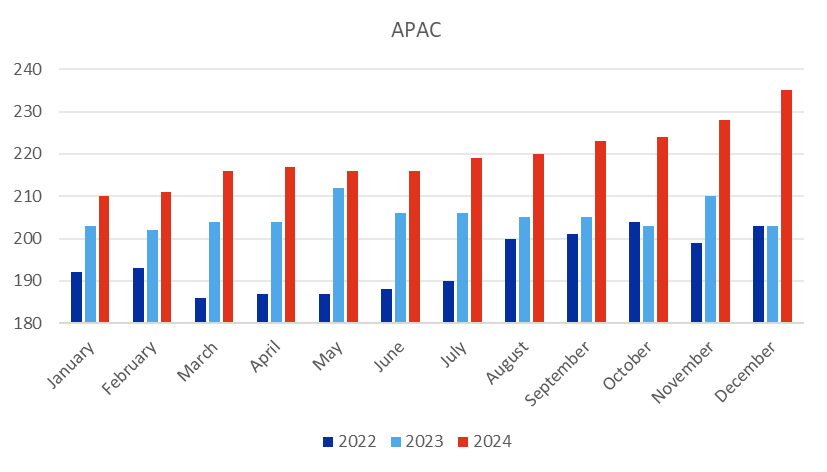
Figure 4: Number of listed REITs in the EMEA region between January 2022 - December 2024

While the number of listings rose, the market capitalisation of REITs at the end of 2024 fell 5.6% compared to 2023, totalling USD 218.30 billion, due to declines in the Americas and APAC regions of 18.3% and 5.5%, respectively, while EMEA region rose 16.5%.
Regionally, the APAC region accounts for 79% of the REITs market capitalisation, with the Americas and EMEA regions accounting for 12% and 9%, respectively.
Quarter-on-quarter, in Q4 2024 the market capitalisation went down 6.5%, due to the Americas and APAC regions falling 2.9% and 8.2%, respectively, while EMEA region rose 4.9%.
Figures 5-8 illustrate the trends in REITs market capitalisation across regions between January 2022 and December 2024.
Figure 5: Market capitalisation of REITs between January 2022 - December 2024

Figure 6: Market capitalisation of REITs in Americas region between January 2022 - December 2024

Figure 7: Market capitalisation of REITs in APAC region between January 2022 - December 2024

Figure 8: Market capitalisation of REITs in EMEA region between January 2022 - December 2024

In conclusion, this study shows regional difference in REITs growths in 2024. The APAC region continued to dominate the market both in the number of listings and market capitalisation. The Americas region experienced declines in both measures. In contrast, EMEA region experienced increased market capitalisation despite limited growth in listings. This mixed result could be due to lower base interest rates failing to deliver expected growth in the REITs sector in some regions, with investors probably leaning more towards other asset classes.
For more WFE statistical reports, please click here.
For our research papers on emerging markets, SMEs, sustainability, technology etc, please click here.
For our regulatory affairs papers on clearing, cross-border, market integrity, market structure, risk or technology, please click here.