REITs value traded
In this article, we analyse the trends in REITs value traded observed over the past year. The data is available on the WFE Statistics Portal, while the indicators are defined in our Definitions Manual. For questions or feedback about this article, please contact the WFE Statistics Team at [email protected]
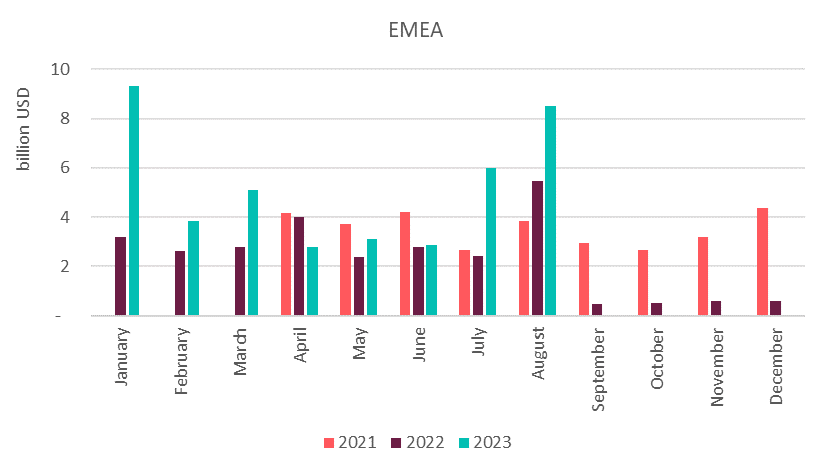
The REITs value traded in H1 2023 amounted to 98.88 billion USD, which represented a 13.3% rise from H2 2022. This result was due to 168.6% increase in the EMEA region, while the Americas and APAC regions declined 8.5% and 5.6%, respectively.
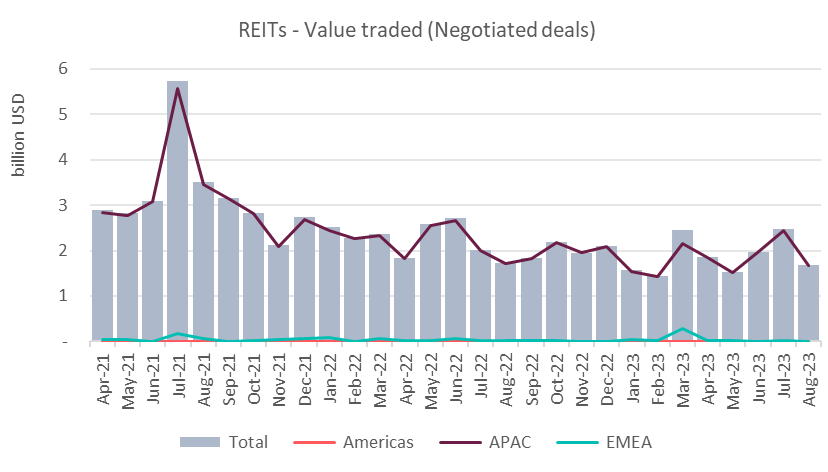
While value traded EOB rose 16.7%, value traded through negotiated deals went down 8.3%.
89% represents value traded EOB with only 11% being value traded through negotiated deals.
Regionally, 60% of the value is traded on APAC markets, 27% on EMEA markets and the rest of 13% on markets in the Americas region.
When compared to H1 2022 REITs value traded decreased 14.9%, result caused by the Americas and APAC regions which fell 40.9% and 23.1%, respectively, while EMEA region went up 52.8% (as Figure 1 shows). During the same period, both value traded EOB and value traded through negotiated deals declined 13.5% and 24.5%, respectively.
Figure 1: REITs value traded total between Apr 2021 - Aug 2023
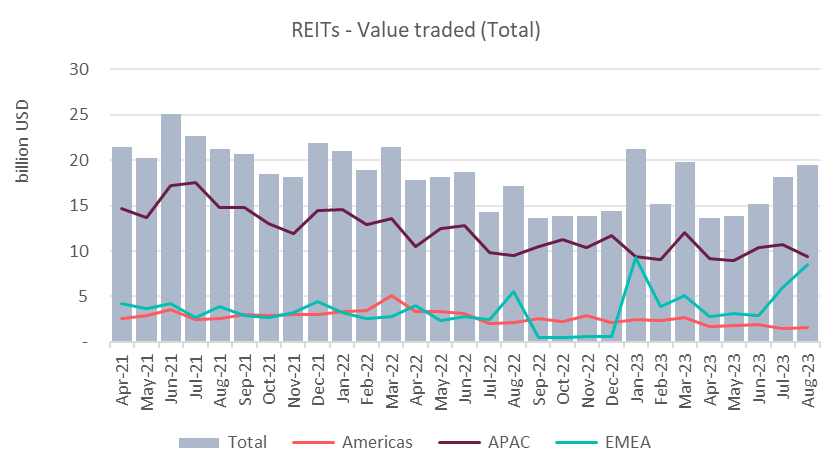
Figure 2: REITs value traded EOB between Apr 2021 - Aug 2023
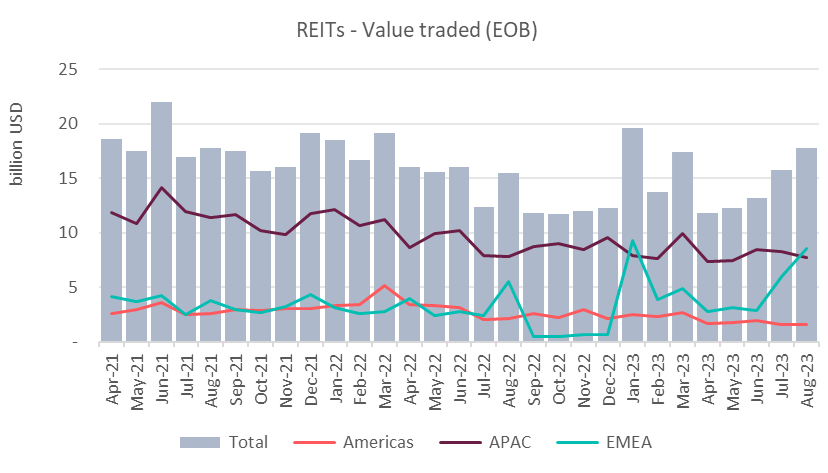
Figure 3: REITs value traded negotiated deals between Apr 2021 - Aug 2023
Quarter-on-quarter, in Q2 2023 value traded declined 24.2%, amounting to only 42.64 billion USD, due to all regions decreasing: the Americas 28.2%, APAC 6.4% and EMEA region 52.1%. A similar decline (-22.1%) was observed when compared to Q2 2022, caused by all regions going down: the Americas 45.6%, APAC 20.2% and EMEA region 4.2%.
Both value traded EOB and through negotiated deals declined 26.6% and 2%, respectively, when compared to Q1 2023.
When compared to Q2 2022, the same trend was noticed, with value traded EOB and value traded through negotiated deals decreasing 21.6% and 25.1%, respectively.
Regional volumes are illustrated in Figures 4-6.
Figure 4: REITs value traded total in the Americas region between Apr 2021 - Aug 2023
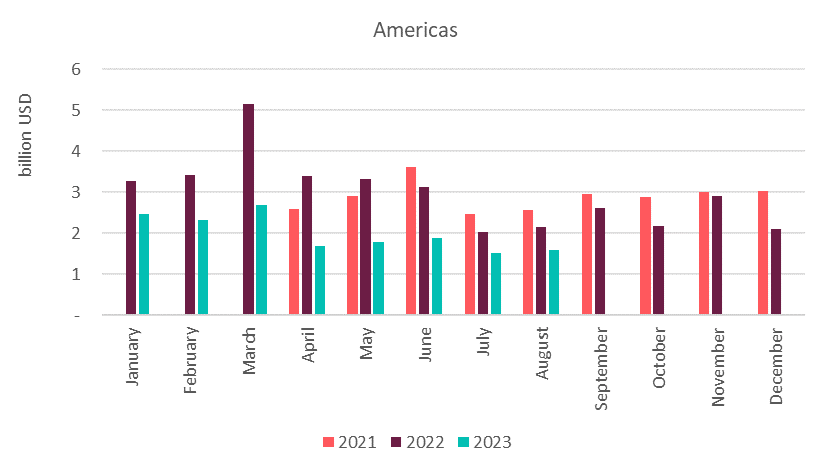
Figure 5: REITs value traded total in APAC region between Apr 2021 - Aug 2023
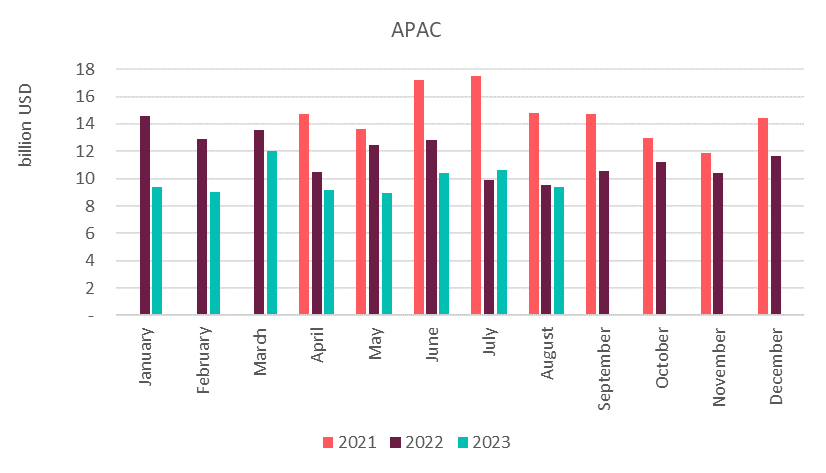
Figure 6: REITs value traded total in EMEA region between Apr 2021 - Aug 2023