Showcasing successful bond markets
Bonds have historically been mostly traded Over-The-Counter (OTC), with relatively low volumes being exchange-traded. While this could be due to the characteristics of bonds as financial instruments, there is also evidence suggesting that bonds can be successfully traded on exchanges. In fact, several exchanges worldwide host very liquid bond markets, characterised by billions of dollars of bond trading every month. What underlying conditions facilitated the development of successful bond markets in some places rather than in others? And how can exchanges attract trading activity from the OTC market to the exchange?
In this article, we showcase three exchanges (the Tel-Aviv Stock Exchange, the Korea Exchange and BME Spanish Exchanges) characterised by high volumes of trading activity in bonds. We present simple trends and statistics, to provide evidence that developing liquid secondary bond markets is possible, though at present it is more the exception than the norm. After presenting statistics on these exchanges, we provide hints for future research on the topic. [1]
Tel Aviv Stock Exchange
The Tel-Aviv Stock Exchange (TASE) has a very liquid bond trading platform, as also mentioned in an academic paper on the topic.[2]
TASE is home to over 700 bond listings as of April 2020, the vast majority of which are domestic corporate bonds. Figure 1 shows the trend in bond listings over the January 2010 – April 2020 period. As evident from the graph, the number of bond listings has hovered around 700 for the last ten years:
Figure 1: Bond listings on TASE
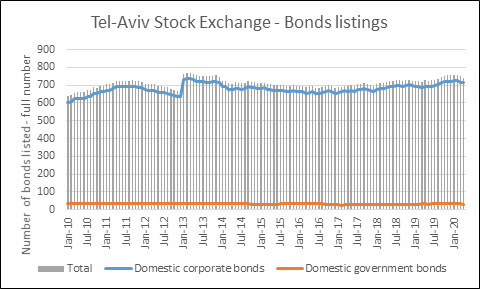
Source: WFE
Trading activity takes place mostly through the limit order book, with monthly trading volumes hovering between 15 to 20 billion USD. Roughly ¾ of these volumes are attributable to domestic government bonds, the category that sees the lower amount of listings (as of April 2020 there were 30 government bonds listed on TASE, as opposed to 713 corporate bonds). Figure 2 displays LOB trading activity on TASE. As evident from the graph, over the January 2010 – April 2020 period no particular downward or upward sloping trend can be identified. The peak in March 2020 is attributable to heightened uncertainty due to COVID-19.
Figure 2: LOB trading activity on TASE
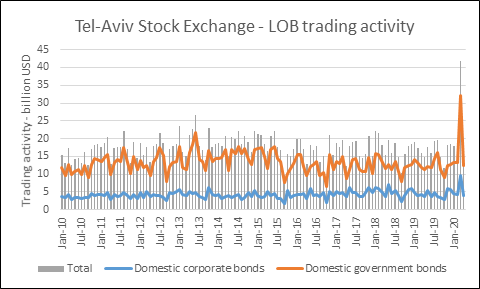
Source: WFE
Dealers account for a non-negligible amount of trading activity, though much smaller than the LOB volumes. Monthly trading volumes have hovered around 3-4 billion USD over the January 2010 – April 2020 period, with the vast majority of these volumes attributable to domestic government bonds. Figure 3 displays dealers’ trading activity on TASE. As evident from the graph, apart from a rapid increase from January 2010 to the first half of 2011, over the June 2011 – April 2020 period no particular downward or upward sloping trend can be identified.
Figure 3: Dealers’ trading activity on TASE
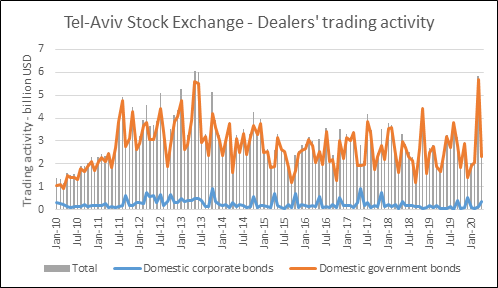
Source: WFE
Finally, we must note that TASE also has a vibrant primary bond market that attracts between 2-3 billion USD per month on average, thus playing an important role in the funding of the Israeli economy.
Figure 4: Capital raised through bond listings on TASE
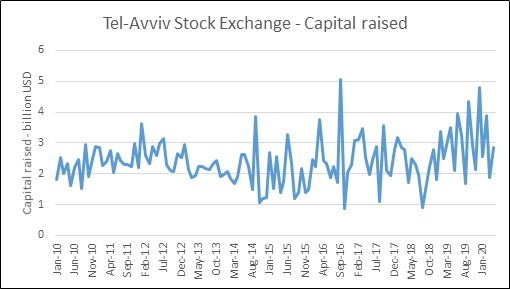
Source: WFE
To conclude, TASE is a vibrant exchange for bonds, characterised by 700+ listings (largely corporate bonds), 15-20 billion USD of trading passing through the limit order book every month, and an additional 3-4 billion USD traded bilaterally on the exchange. Bond issuances attract between 2-3 billion USD per month.
Korea Exchange
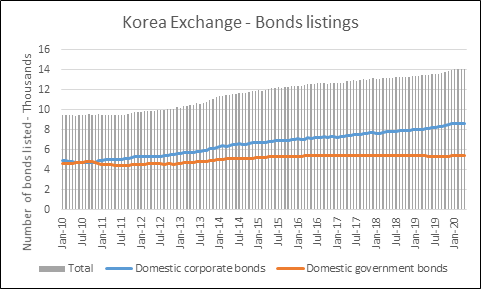
The Korea Exchange (KSX) is one of the largest bond markets in the world. KSX was home to over 14,000 bond listings as of April 2020, 61% of which were domestic corporate bonds. Figure 5 shows the trend in bond listings over the January 2010 – April 2020 period. As evident from the graph, the number of bond listings has increased over the years, starting at just below 9,500 in January 2010:
Figure 5: Bond listings on KSX
Source: WFE
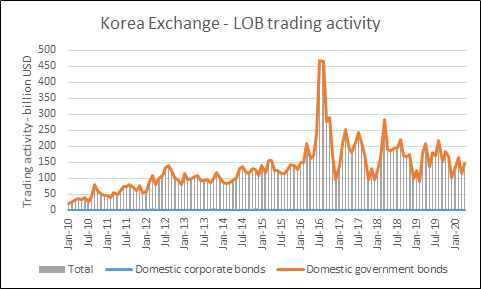
Like TASE, trading activity on KSX trades place mostly through the limit order book, with monthly trading volumes hovering between 150 to 200 billion USD over the course of 2019. We notice that KSX LOB bond trading volumes see an upward trend, with LOB volumes starting at roughly 20 billion USD as of January 2010, suggesting that trading volumes became roughly seven times larger in 10 years. Almost all of the trading volumes are attributable to domestic government bonds. Figure 6 displays LOB trading activity on KSX.
Figure 6: LOB trading activity on KSX
Source: WFE
Dealers account for a non-negligible amount of trading activity in absolute terms, though not at all comparable to LOB volumes. Monthly trading volumes have hovered around 1-2 billion USD over the March 2018 – April 2020 period, as evident from Figure 7.
Figure 7: Dealers’ trading activity on KSX
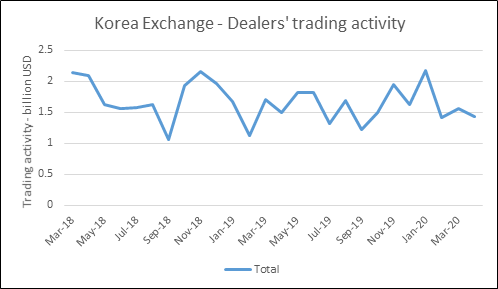
Source: WFE. Note: dealers’ trading data available only for the March 2018 – April 2020 period.
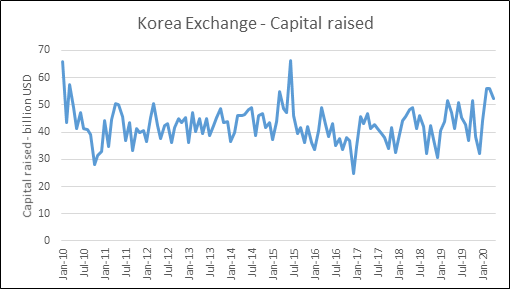
Given the size of the market, it is no surprise that KSX also has a dynamic primary bond market that attracts between 40-50 billion USD per month on average, thus playing an important role in the funding of the Korean economy.
Figure 8: Capital raised through bond listings on KSX
Source: WFE
To conclude, KSX is a successful, liquid exchange for bonds, characterised by roughly 9,500 listings (61% corporate bonds), 150 to 200 billion USD of trading (largely government bonds) passing through the limit order book every month, and an additional 1-2 billion USD traded bilaterally on the exchange. Bond issuances attract between 40-50 billion USD per month.
BME Spanish Exchanges
BME Spanish Exchanges (BME) is the largest bond market in Europe in terms of trading activity, and was home to over 3,000 bond listings as of April 2020. Historically, more than 80% of the listings on BME have been domestic corporate bonds (Source: WFE). Figure 9 shows the trend in bond listings over the January 2010 – April 2020 period. As evident from the graph, the number of bond listings has decreased over the years, starting at just above 4,600 in January 2010, and with a peak at nearly 6,000 in 2012:
Figure 9: Bond listings on BME
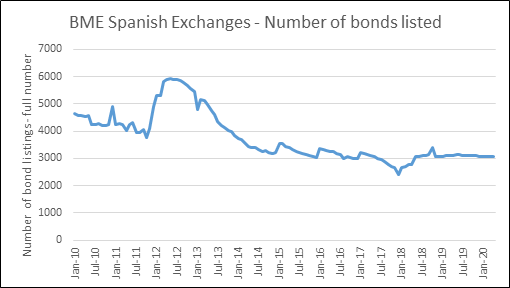
Source: WFE
Trading through the limit order book is sizable, with monthly trading volumes hovering between 25 to 30 billion USD over the course of 2019. LOB volumes were at 2020 levels during 2010-2011, declines sharply during 2012, and grew to reach pre-2012 levels over the following 8 years. Historically, almost all of the trading volumes have been attributable to domestic government bonds (Source: WFE). Figure 10 displays LOB trading activity on BME.
Figure 10: LOB trading activity on BME
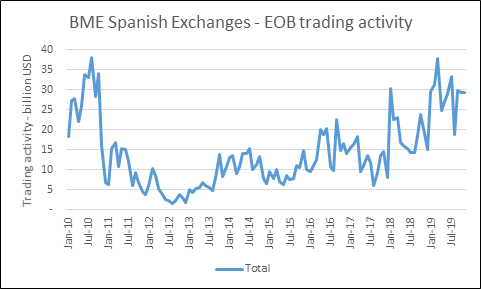
Source: WFE
Similarly to TASE and KSX, BME also has a dynamic primary bond market attracting 20-40 USD per month on average, thus playing an important role in the funding of the Spanish real economy.
Figure 11: Capital raised through bond listings on BME
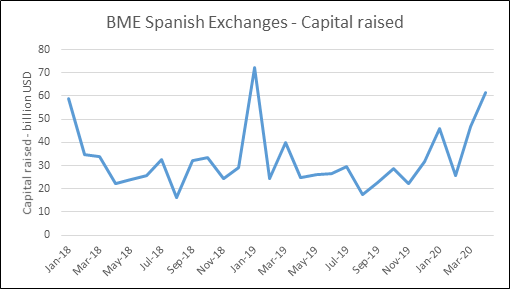
Source: WFE. Note: capital raised data available only for the January 2018 – April 2020 period
To conclude, is a successful, liquid exchange for bonds, characterised by roughly 3,000 listings (largely corporate bonds), 25 to 30 billion USD of trading (largely government bonds) passing through the limit order book every month, and very active primary market, with bond issuances attracting between 20-40 billion USD per month.
Hints for future research
These analyses, although simple, provide relevant hints for future research. The first, perhaps natural question is: what are the underlying conditions that allow the development of successful bond exchanges in jurisdictions with apparently very different characteristics? And how do exchanges manage to attract trading activity from the OTC market? Is it just a matter of offering lower transaction costs, or exchanges and regulator can do more?
The dynamics of bond trading activity within the exchange are also interesting. All three exchanges herein described, for example, are characterised by higher amounts of corporate bond listings, but trading activity largely is concentrated in government bonds. Is this happening in other exchanges too? And if so, why is that the case, and how can exchanges obtain higher levels of trading activity in corporate bonds? We noticed that TASE and KSX are characterised by higher LOB than dealers’ volumes. What explains the balance between LOB and dealers’ trading activity within the exchange? Is this mainly a function of transaction costs, or is it the result of more complex considerations? Our research aims to shed light on these questions.
[1] This article is part of a broader research project on how to develop a successful exchange for bonds, conducted in collaboration with academics at the University of Nottingham.
[2] Abudy, M. and Wohl, A. (2017), Corporate Bond Trading on a Limit OrderBook Exchange, Review of Finance, 1-28.