Fixed Income Tradable Ecosystem: North American and European Credit Markets
The global bond markets are extensive, with individual bonds all trading with their own unique terms, coupons and maturities. Individual bonds are also often illiquid or difficult to source and, therefore, not broadly available. Fixed income indices have helped standardize the bond markets, taking this largely over-the-counter (OTC) market and creating defined units. These units can be as broad as the total market or can focus on key segments like high yield or investment grade corporate bonds, mortgage-backed securities, or municipal bonds, to name a few. Indices can be further subdivided by rating band, maturity range, sector or sustainability characteristics, among plenty of other dimensions.
Fixed income tradable indices take this one step further by offering market participants strategies that may be used as the basis for tradeable products. Fixed income tradable indices underlie financial products that take a number of forms, including ETFs, standardized total return swaps, futures and credit default swap indices. These instruments have evolved to track a liquid segment of the bond markets and offer options including inherent diversification, investability and trade efficiency. These instruments also offer transparency, given that index construction methodologies are public and memberships for indices’ underlying fixed income tradable products are often public as well. Further, fixed income tradable indices enhance transparency by providing a measure of continuous pricing to the bond markets.
Fixed income tradable indices are designed to provide an efficient means to measure the bond market. This primer is meant as an introductory reference for these instruments, as well as to highlight their performance in recent market periods. While some of these instruments measure similar market segments, each instrument type comes with unique features that make them potentially more attractive under different trade conditions.
As the fixed income tradable index ecosystem has developed, the addition of new tools has proven to be accretive to volumes across instruments (see Exhibit 1).
Exhibit 1: Fixed Income Tradable Ecosystem Linked to S&P Dow Jones Indices
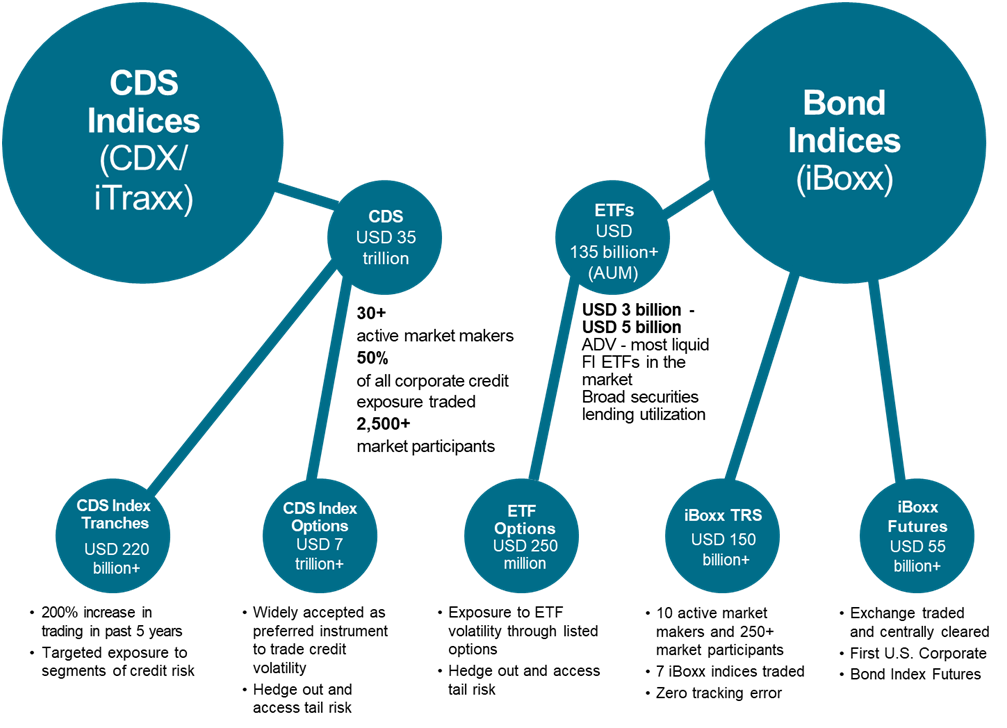
Source: S&P Dow Jones Indices LLC, DTCC and OSTTRA. Data as of Dec. 31, 2022. Chart is provided for illustrative purposes.
From Benchmarks to Tradables
The transition from broad benchmarks to liquid indices designed to underlie tradable products involves careful construction intended to select liquid index constituents. The final composition aims to reflect liquid segments of the market, while also limiting idiosyncratic risk via capping. Efficiency and transparency in the underlying index may enhance the ease of replication with investment products.
Bond Indices – iBoxx Benchmark versus iBoxx Liquid
Within iBoxx, tradable products are typically based on liquid rather than broad benchmark indices. The broad benchmark indices aim to provide a holistic representation of the market to the extent possible, while still maintaining basic selection criteria to ensure the quality of the benchmark. The liquid indices employ much more rigorous index selection criteria compared with the broad benchmark indices to ensure only the most liquid bonds qualify for the index.
We can see the extent to which the liquid indices filter the broader benchmark universe by comparing the criteria for the iBoxx USD Liquid High Yield Index with the iBoxx USD High Yield Developed Markets Index (see Exhibit 2).
Exhibit 2: Index Comparison
|
Category |
iBoxx USD Liquid High Yield Index |
iBoxx USD High Yield Developed Markets Index |
|
Minimum Amount Outstanding |
$400 million |
$200 million |
|
Minimum Issuer Size |
$1 billion |
NA |
|
Issuer Cap |
3% |
NA |
|
Lockout Period |
3 months |
NA |
|
Minimum Run |
6 months |
NA |
|
Minimum Time to Maturity |
12 months, 18 months for new insertions |
12 months |
Source: S&P Dow Jones Indices LLC. Criteria as of February 2023. Table is provided for illustrative purposes.
Comparing the two indices, the required minimum amount outstanding per issue doubles from $200 million to $400 million for the liquid index. Also, the iBoxx USD Liquid High Yield Index introduces an issuer size criterion, such that the overall issuer must have a minimum of $1 billion in debt outstanding. These criteria target the most liquid segment of the high yield market, selecting the most liquid bonds from the most liquid high yield issuers. The iBoxx USD Liquid High Yield Index also includes an issuer weighting cap of 3%, which helps ensure the index is diversified and prevents idiosyncratic risk from affecting the index’s risk/return profile.
The iBoxx USD Liquid High Yield Index also has minimum run criteria, so that new entrants remain in the index for six months after their addition, except for upgrades or defaults. It also has a three-month lockout period, which prevents bonds that get removed from the index from rejoining for three months from the point of removal, even if the bond subsequently meets all other criteria for the index. The minimum run and lockout period rules are unique to the iBoxx USD Liquid High Yield Index and have the effect of reducing turnover within the index, which enhances tradability by avoiding arbitrary trading costs.
As of Dec. 31, 2022, the effect of these enhanced liquidity measures filtered the iBoxx USD High Yield Developed Markets Index value down from a par value of $1.4 trillion to $1 trillion in the iBoxx USD Liquid High Yield Index, with the number of bonds included decreasing from 2,021 to 1,169.
CDS Indices – Tradable by Nature
iTraxx/CDX indices reflect tradable baskets of single-name credit default swaps. Unlike bond indices, they do not necessarily require a “wrapper” instrument to provide exposure to the index. Designed for potential use as a tradeable basket, liquidity is arguably the most important criterion in the construction of the iTraxx/CDX indices. The index composition consists of names that have exhibited the most trading activity in the CDS market at the time of index selection, while satisfying other index-specific criteria such as ratings and debt outstanding.
For instance, the selection criteria for the iTraxx Europe, which is a sector-diversified European investment grade index, involves the most liquid European investment grade names without breaching any of the sector limits (see Exhibit 3). The sector ranges allow for some flexibility to include the most liquid credits in the index while also maintaining broad sectoral exposure.
Exhibit 3: iTraxx Europe – Minimum and Maximum Sector Constituent Count
|
iTraxx Europe Sectors |
Minimum Constituent Count |
Maximum Constituent Count |
|
Autos & Industrials |
24 |
36 |
|
Consumers |
20 |
30 |
|
Energy |
16 |
24 |
|
Technology, Media and Telecom (TMT) |
16 |
247 |
|
Financials |
30 |
30 |
Source: S&P Dow Jones Indices LLC. Criteria as of February 2023. Table is provided for illustrative purposes
A Growing Toolkit – A Choice Matrix
How do investors choose between the different indices that are available? There’s no single answer—it depends on the objective and other criteria, some of which are delineated below. There are several decision spectrums to consider.
Unfunded versus Funded Exposure
If an investor received a cash inflow and wants to gain benchmark exposure, fixed income ETFs are a method for doing so. Unfunded instruments make it possible to obtain more than 100% market exposure, hedge a given exposure by taking a short position or engage in portable alpha across markets. Unfunded products can also be used to replicate funded positions by fully collateralizing the notional amount of the exposure.
iBoxx Cash Bond Indices versus iTraxx/CDX CDS Indices
One key difference between iBoxx cash bond indices and iTraxx/CDX CDS indices would be the correlation to the cash market versus pure credit exposure. iBoxx-linked products, such as fixed income ETFs, iBoxx TRS and iBoxx Corporate Bond Index futures, provide broad exposure that includes both rate and credit exposure similar to the target bond market segment. For indices with pure credit exposure, whether for exposure or hedging, CDS indices like CDX and iTraxx are options. CDS indices reflect a macro exposure with instruments with relatively narrow bid-ask spreads.
There are also certain structural differences between the iBoxx bond indices and CDS indices. First, while iBoxx bond indices are market-cap weighted, CDS Indices are equally weighted. Second, CDS indices reflect fixed tenors, with the five-year tenor being the most liquid, whereas iBoxx indices are constructed with bonds of varying maturities. Third, instruments tracking iBoxx bond indices provide exposure to the underlying bonds used to construct the indices, whereas CDS indices provide exposure to the broad credit risk of the issuers themselves. Finally, CDS indices are more region specific, whereas iBoxx indices are mostly currency based. For instance, while the iBoxx USD Liquid Investment Grade Index may contain USD bonds issued by European issuers, its CDS counterpart, the CDX North American High Yield Index, contains North American issuers only. That being said, both iBoxx bond indices and CDS indices are transparent and rules-based with strong governance structures, which makes them robust instruments for the marketplace.
Liquidity and Trade Efficiency
When it comes to instrument selection for market participants, liquidity and trade efficiency are often key considerations. Liquidity helps to make sure that the ideas and strategies of the investor are actually implementable in the market in the intended manner. Trading costs in the form of high bid-offer spreads, and additional costs associated with establishing large positions in a single trade, can often lead to diminished returns from the strategy or inefficient hedging.
Swaps on iTraxx/CDX indices and ETFs tracking the iBoxx indices tend to be highly liquid instruments based on the average daily volume (ADV) metric. Furthermore, in terms of bid-offer spreads, swaps on CDS indices are efficient, with the European and North American investment grade indices trading at bid-offer spreads of even less than one basis point on most days. CDS indices and ETFs, due in part to their ease of access, have also shown that their liquidity actually tends to improve in times of market stress, despite any illiquidity of the underlying bonds. This was seen in March 2020, when overall market underlying bond liquidity was dwindling due to the selloff induced by the onset of the COVID-19 pandemic; swaps based on CDS Indices and ETFs on iBoxx indices were the few instruments that provided essential market information through record-high volumes and transparency.
iTraxx/CDX Swaptions reflect exposure to credit volatility and experienced record volumes in 2022, exceeding $7 trillion (see Exhibit 4). These swaptions are available to trade on multiple Swap Execution Facilities (SEF) and Multilateral Trading Facilities (MTF) under a centralized clearing framework. Due to their standardized structure, coupled with the ability to trade in various strikes and maturities, CDS index options enhance the diverse set of tools available to market participants to manage exposure.
Finally, iBoxx Standardized Total Return Swaps (TRS) and iBoxx Corporate Bond Index Futures offer broad fixed income exposure with higher efficiency in terms of tracking error as the instruments settle at the index level itself. While iBoxx TRS have shown consistent volumes since their inception in 2012, iBoxx futures are relatively new instruments, with trading commencing in late 2018.
Exhibit 4: Fixed Income Tradable Instruments – Liquidity Metrics
|
Instruments |
Exposure |
Underlying Index |
2022 Annual Volumes |
2022 Average Daily Volume |
2022 Average Bid-Ask Spread[1] |
|
EUR IG |
iBoxx EUR Liquid Corporates Large Cap Index |
$467 million |
$1.9 million |
$0.16 |
|
|
EUR HY |
iBoxx EUR Liquid High Yield Index |
$2.7 billion |
$10.8 million |
$0.15 |
|
|
USD IG |
iBoxx USD Liquid Investment Grade Index |
$551 billion |
$2.2 billion |
$0.07 |
|
|
USD HY |
iBoxx USD Liquid High Yield Index |
$752 billion |
$2.9 billion |
$0.01 |
|
|
Swaps on iTraxx/CDX Indices |
EUR IG |
iTraxx Europe |
$13.2 trillion |
$52.3 billion |
1.1 bps |
|
EUR HY |
iTraxx Crossover |
$3.3 trillion |
$13.1 billion |
5.6 bps |
|
|
USD IG |
CDX.NA.IG |
$13.7 trillion |
$54.4 billion |
0.6 bps |
|
|
USD HY |
CDX.NA.HY |
$3.9 trillion |
$15.3 billion |
2.7 bps |
|
|
iTraxx/CDX Swaptions |
EUR IG |
iTraxx Europe |
$3.4 trillion |
$13.3 billion |
3.8 bps |
|
EUR HY |
iTraxx Crossover |
$787 billion |
$3.1 billion |
17.3 bps |
|
|
USD IG |
CDX.NA.IG |
$2.6 trillion |
$10.4 billion |
4 bps |
|
|
USD HY |
CDX.NA.HY |
$590 billion |
$2.3 billion |
17.4 bps |
|
|
iBoxx TRS |
EUR IG |
iBoxx EUR Corporates Index |
$14 billion |
$56 million |
47 bps |
|
EUR HY |
iBoxx EUR Liquid High Yield Index |
$12 billion |
$50 million |
61 bps |
|
|
USD IG |
iBoxx USD Liquid Investment Grade Index |
$17 billion |
$66 million |
35 bps |
|
|
USD HY |
iBoxx USD Liquid High Yield Index |
$86 billion |
$341 million |
30 bps |
|
|
iBoxx Futures |
USD IG |
iBoxx iShares $ High Yield Corporate Bond Index |
$18 billion |
$72 million |
6 bps |
|
USD HY |
iBoxx iShares $ Investment Grade Corporate Bond Index |
$38 billion |
$152 million |
7 bps |
Source: S&P Dow Jones Indices LLC. Data as of Dec. 31, 2022. Past performance is no guarantee of future results. Table is provided for illustrative purposes.
For iTraxx/CDX Indices, the table reflects the bid-ask spreads for the five-year tenors of the on-the-run series of the respective indices.
For iTraxx/CDX Swaptions, the table reflects the payer/receiver bid-ask spreads for the three-month at-the-money (standard strike closest to the reference level) swaption contracts referencing the on-the-run series of the respective indices. For at-the-money swaptions, the payer and receiver bid-ask spreads are roughly the same.
For iBoxx TRS, the table reflects the bid-ask spreads for iBoxx TRS contracts maturing within the next three months.
Tax Considerations
Short-term trading using futures may benefit from a blended rate that weights toward the long-term capital gains rate. Also, using fixed income ETFs may have the tax advantage that investors are only taxed when they trade, rather than when others in the fund trade, as is the case for certain other fund wrappers.
Summary
Exhibit 5 summarizes some of the information market participants may consider when evaluating tradable wrappers.
Exhibit 5: Summary of the Tradable Instruments
|
Instrument |
Funding |
Duration/ |
Liquidity |
Diversified Exposure |
Establishing Size Position |
Can Be Shorted?/ |
Tracking/ |
Access |
|
Cash Bonds |
Funded |
Yes |
Medium/Low |
No, unless in a diversified portfolio |
Time consuming |
Difficult/
|
Exact exposure |
OTC |
|
ETFs |
Funded |
Yes |
High |
Yes |
Varied |
Yes/Can be expensive |
Some tracking error |
Exchange traded |
|
iBoxx TRS |
Unfunded |
Yes |
Medium |
Yes |
Easy |
Yes/Less expensive |
Zero tracking error |
SEFs/MTFs, OTC, 10 active market makers |
|
iTraxx/CDX Indices |
Unfunded |
No/Pure Credit |
Very High |
Yes, narrower |
Very easy |
Yes/Not expensive |
Higher tracking error/Narrow exposure |
SEFs/MTFs, (centrally cleared), over 30 active market makers |
|
iTraxx/CDX Swaptions |
Unfunded |
No/Pure Credit |
High |
Yes, narrower |
Easy |
Yes/Not expensive |
Higher tracking error |
SEFs/MTFs, (centrally cleared), supported by all major CDS index market makers |
|
iBoxx Futures |
Unfunded |
Yes |
New |
Yes |
Easy |
Yes/Not expensive |
Closely tracks ETF & BM |
Exchange traded |
|
iTraxx/CDX Tranches |
Unfunded |
No/Pure Credit |
Medium |
Yes, narrower |
Easy |
Yes/Not expensive |
Idiosyncratic exposure |
SEFs/MTFs, supported by all major CDS index market makers |
|
ETF Options |
Unfunded |
Yes |
Medium |
Yes |
Easy |
Yes/Not expensive |
Some tracking error |
Exchange-traded |
Source: S&P Dow Jones Indices LLC. Table is provided for illustrative purposes.
These tools are not traded in isolation. There is a robust market in relative value trading between them. For example, traders may review if they deem futures to be relatively costly against ETFs tracking the same exposure. This then may present an arbitrage opportunity to long one and short the other. In turn, this type of investor drives price efficiency by ensuring that tradable instruments do not trade away from the underlying index they track. There are plenty of other mechanisms in place to drive price efficiency as well. Fixed income ETFs have the create and redeem process to help enable ETFs to track their underlying market. iBoxx TRS and futures settle against official index levels at contract expiry, so, at maturity, investors receive the market return over the period with minimal tracking error. The two-way liquidity in the CDS indices helps the indices reflect the current cost of protecting against credit losses, or the compensation for providing credit funding.
Market Structure
Trading and Clearing
ETFs and iBoxx Futures are traded on an exchange, which makes them highly transparent and easy to execute. A wide range of authorized participants, other liquidity providers and high frequency traders actively involved in the market can affect investors’ decision-making around ETFs and iBoxx futures for their intended use cases. In addition to supporting the liquidity of the ETFs themselves, authorized participants also enhance liquidity of the underlying bonds through the creation and redemption mechanism built into the functioning of ETFs, which makes the resulting market information more complete.
For OTC derivatives, the success of the instruments is largely linked to the number of market makers providing liquidity, which helps to ensure efficiency of the products in the market. Swaps on iTraxx/CDX indices are highly liquid credit derivative instruments, with over 30 active market makers providing liquidity. iTraxx/CDX swaptions are also supported by major CDS market makers, and the increased use of these instruments in quantitative strategies continues to contribute to the expansion of this market.
There has been a growing trend toward reducing risk by trading under a clearing framework and execution in established SEFs and MTFs. Both CDS-based instruments and iBoxx TRS are available for trading on SEFs and MTFs, facilitating ease of access to these instruments and enhancing market transparency. Furthermore, iTraxx/CDX indices and swaptions are centrally cleared, reducing counterparty risk. Finally, credit derivative instruments are supported through electronic confirmation of trades through platforms such as OSTTRA for ease of execution and tracking of trade data through structured repositories.
Standardization
Standardization is a major factor in the widespread adoption of fixed income tradable instruments, especially for OTC derivative instruments. CDS-based instruments and iBoxx TRS have standardized contract terms such as fixed coupons, coupon payment dates, maturity dates and credit event procedures (only for CDS) for trade fungibility and enhanced liquidity. Standardized contract terms contribute to improving market efficiency, as all dealers would make markets on the same fungible contract with the same structure. This also allows investors to unwind trades with different dealers and eases the trade novation processes.
The CDS instrument and iBoxx TRS are supported by the International Swaps and Derivatives Association (ISDA) Master Agreement for trading OTC derivative instruments. Once the ISDA Master Agreement is established between counterparties, it can be referred to across a number of trades, eliminating the need for counterparties to specify contract terms for each trade separately. In addition to the ISDA Master Agreement, the CDS instruments are currently further supported by the 2014 ISDA Credit Derivatives Definitions, which is a detailed governing document providing the market standard definitions for CDS transactions. Similarly, iBoxx TRS is currently supported by the 2006 ISDA Interest Rate Derivative Definitions, which is the governing document for derivative transactions involving interest rate components.
In addition to the broader asset class-based definitions provided by ISDA, there is also product-specific documentation for fixed income tradable instruments. Both CDS-based instruments and iBoxx TRS have their own standard terms supplement and confirmation templates for standardization of trades executed by counterparties.
Key Use Cases
Hedging
Unfunded index-based credit instruments enable market participants to hedge macroeconomic credit risk using derivatives, rather than divestment of physical holdings. This can be effected by assuming short exposure using CDS indices, standardized TRS or futures, which may have high correlation with the physical assets.
Relative Value
Investors can also use fixed income tradable index instruments to take advantage of the relative value between different instruments. Relative value trading involves taking advantage of relative mispricing in similar instruments. For instance, due to the underlying indices used to access the USD investment grade market through iBoxx TRS and iBoxx futures contracts being highly similar, the two instruments present a natural opportunity to gain risk premia through relative value trading. Exbibit 6 depicts the index performance of the iBoxx $ Liquid Investment Grade Index (Ticker: IBOXIG, underlying iBoxx TRS) and the iBoxx iShares $ Investment Grade Corporate Bond Index (Ticker: IBXXIBIG, underlying iBoxx Futures) to highlight the similarities between the two indices.
Exhibit 6: iBoxx $ Liquid Investment Grade Index and iBoxx iShares $ Investment Grade Corporate Bond Index Performance
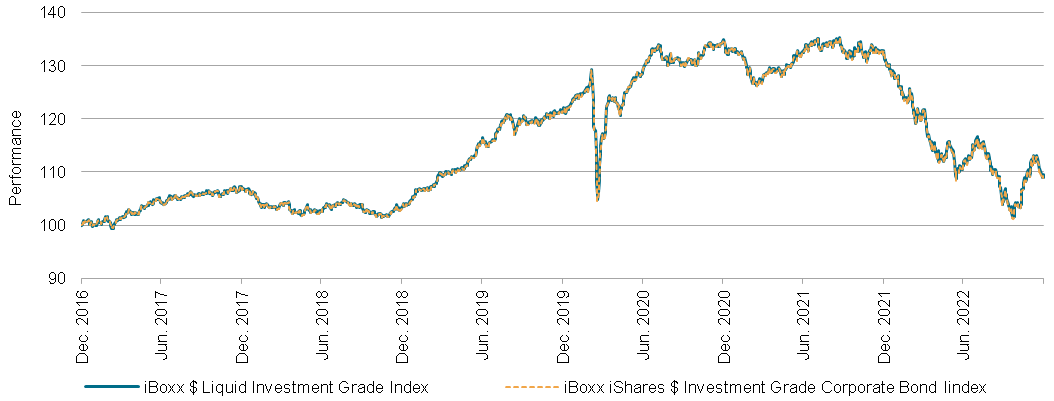
Source: S&P Dow Jones Indices LLC. Data as of Dec. 30, 2022. The iBoxx iShares $ Investment Grade Corporate Bond Index was launched May 18, 2018. All data prior to index launch date is back-tested hypothetical data. Past performance is no guarantee of future results. Chart is provided for illustrative purposes and reflects hypothetical historical performance. Please see the Performance Disclosure at the end of this document for more information regarding the inherent limitations associated with back-tested performance.
A common relative value strategy is to take simultaneous long and short positions in two highly correlated assets, allowing an investor to potentially earn positive returns on a limited-risk basis.
Liquidity Sleeve
Fixed income tradable instruments can be used to gain quick access to beta exposure and can often act as handy tools even for active investors. Given the relative illiquidity of the cash bond market, these index instruments, coupled with their strong liquidity, are often the instruments of choice across a wide spectrum of fixed income investors.
As an example, let us consider a hypothetical active fixed income fund manager who is tasked with investing a significant amount in the high yield euro market from a recent large inflow into the fund she is managing. While the investor may possess useful skills in security selection and may have a good track record in outperforming the market, sourcing the specific bonds at favorable prices can still be a time-consuming process, given the nature of the cash bond market. This is often the cause of “cash drag” in funds, where recent cash inflows do not generate any return due to the absence of liquid instruments to obtain the required exposure. In such cases, liquid funded index instruments such as ETFs tracking the iBoxx EUR Liquid High Yield Index, with an average daily volume of about USD10.8 million in 2022, can be used to immediately put the funds to work, allowing the investor to at least earn market returns and give room to focus on better market timing for individual security selection to generate alpha. Active ETF trading not only enables establishing large positions in the euro high yield bond market, but also allows for gradual unwinding of the position in ETFs as and when the alpha generating positions have been identified.
Credit Volatility
As alluded to before, investors can also take advantage of the fixed income tradable ecosystem to express views on or hedge volatility in the credit markets. In recent years, there has also been growth in volatility-based products within the fixed income tradable ecosystem. While iTraxx/CDX swaptions are fairly mature products, with over $7 trillion notional traded, there has been recent growth in options referencing U.S.-listed ETFs as well. While iTraxx/CDX swaptions can help provide exposure to pure credit volatility, options on bond ETFs provide exposure to credit and rates volatility. The two kinds of options-based products can complement each other to suit specific needs.
iTraxx/CDX swaptions and ETF options can be used to implement all kinds of standard options strategies or to hedge downside risk. The instruments can also be used to take a view on implied and realized volatility in macro credit markets using iTraxx/CDX swaptions. Implied volatility, as the name suggests, is the forward-looking credit market volatility implied by iTraxx/CDX swaptions, whereas realized volatility is backward-looking credit market volatility calculated based on the movement in the iTraxx/CDX index spreads in that time period. Savvy investors may take advantage of this relationship using iTraxx/CDX swaptions.
Conclusion
Fixed income indices have performed a central role in modernizing fixed income markets, providing transparency and a method for standardization. Fixed income tradable indices go a step further by creating indices designed to underlie tradable instruments, and thereby building a bridge to investor implementation and actionable insight. The breadth of index-based investment vehicles has grown, from ETFs, total return swaps, credit default swap indices, futures and more recently options across CDS indices and ETFs. Index-based tools like fixed income ETFs have also been responsible for increased individual bond liquidity through newer trading practices like portfolio trading. We’ve only just begun to see the impact that indexing will have.
Appendix
Fixed Income Tradable Indices – Index Performance
Exhibit 9: EUR Investment Grade Performance
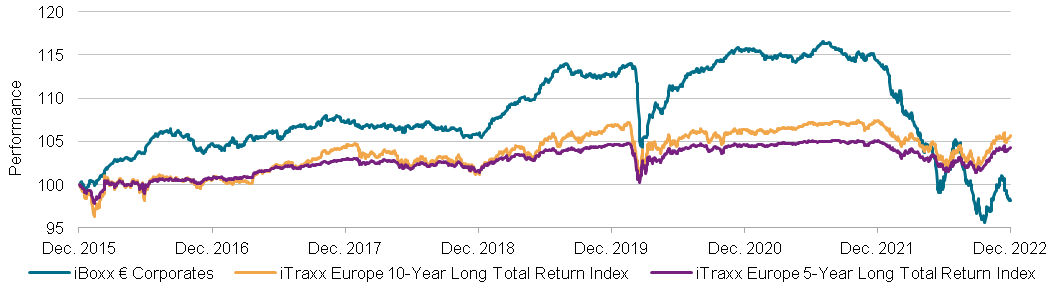
Source: S&P Dow Jones Indices LLC. Data as of Dec. 31, 2022. Past performance is no guarantee of future results. Chart is provided for illustrative purposes.
Exhibit 10: EUR High Yield Performance
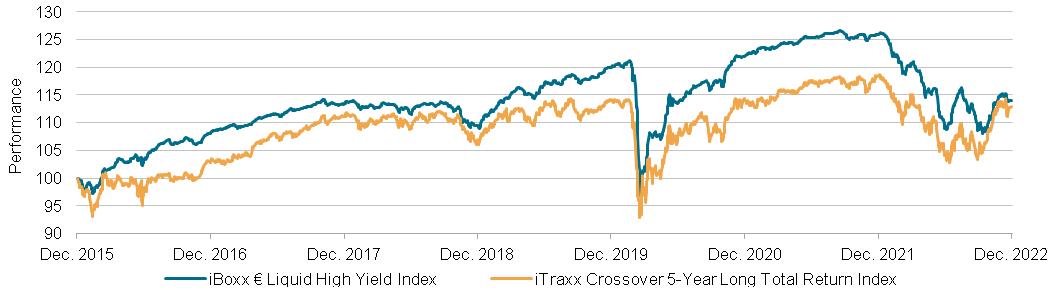
Source: S&P Dow Jones Indices LLC. Data as of Dec. 31, 2022. Past performance is no guarantee of future results. Chart is provided for illustrative purposes.
Exhibit 11: USD Investment Grade Performance
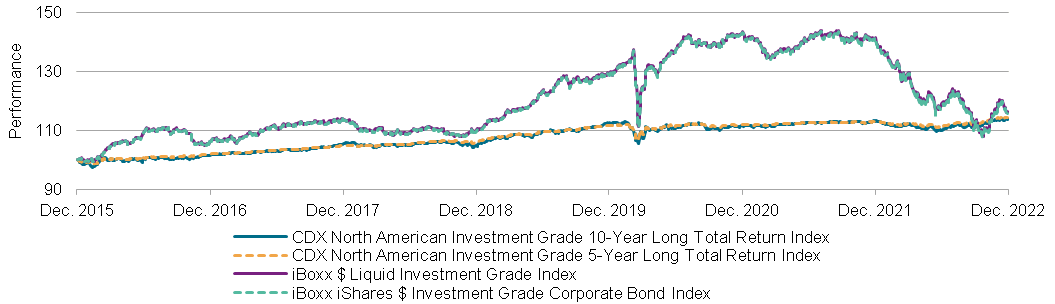
Source: S&P Dow Jones Indices LLC. Data as of Dec. 31, 2022. The iBoxx iShares $ Investment Grade Corporate Bond Index was launched May 18, 2018. All data prior to index launch date is back-tested hypothetical data. Past performance is no guarantee of future results. Chart is provided for illustrative purposes and reflects hypothetical historical performance. Please see the Performance Disclosure at the end of this document for more information regarding the inherent limitations associated with back-tested performance.
Exhibit 12: USD High Yield Performance
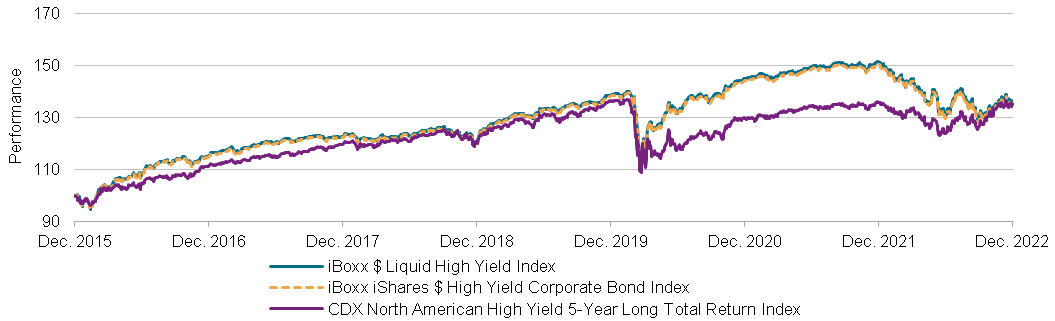
Source: S&P Dow Jones Indices LLC. Data as of Dec. 31, 2022. The iBoxx iShares $ High Yield Corporate Bond Index was launched May 18, 2018. All data prior to index launch date is back-tested hypothetical data. Past performance is no guarantee of future results. Chart is provided for illustrative purposes and reflects hypothetical historical performance. Please see the Performance Disclosure at the end of this document for more information regarding the inherent limitations associated with back-tested performance.
Fixed Income Tradable Products – Annual Volumes
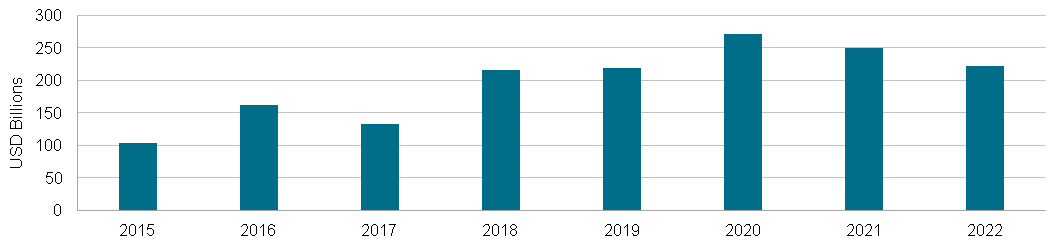
Exhibit 13: CDS Indices Gross Notional Traded
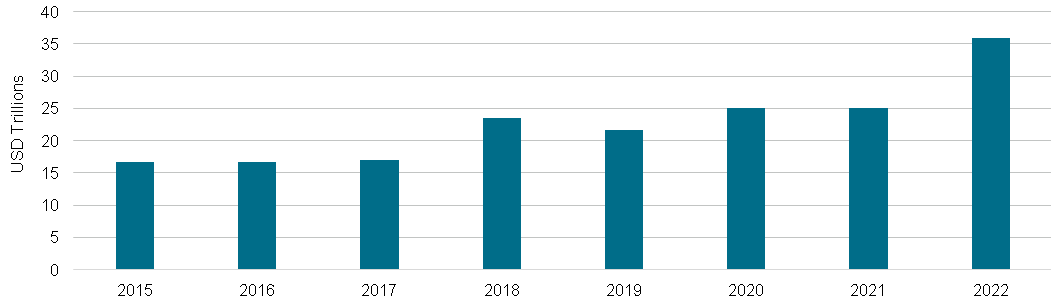
Source: DTCC. Data as of Dec. 30, 2022. Past performance is no guarantee of future results. Chart is provided for illustrative purposes.
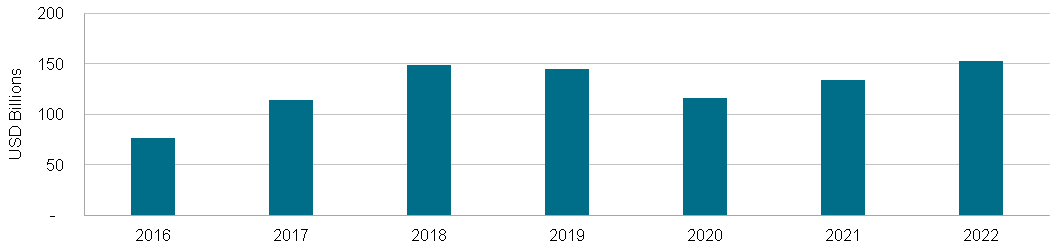
Exhibit 14: iTraxx/CDX Swaptions Gross Notional Traded
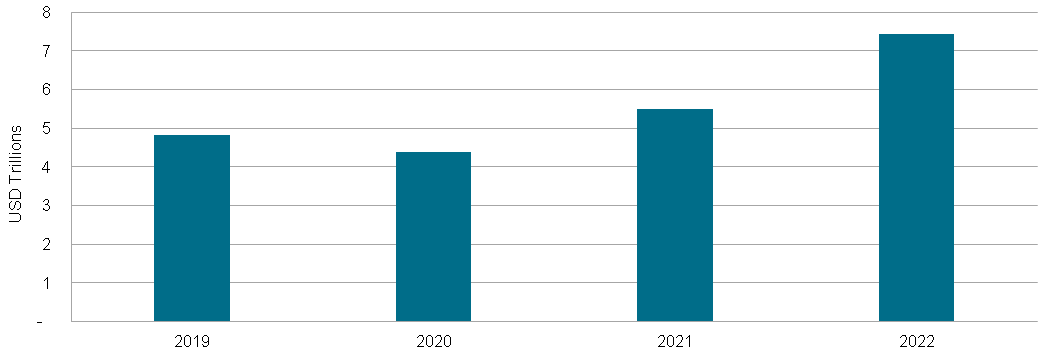
Source: OSTTRA. Data as of Dec. 31, 2022. Past performance is no guarantee of future results. Chart is provided for illustrative purposes.
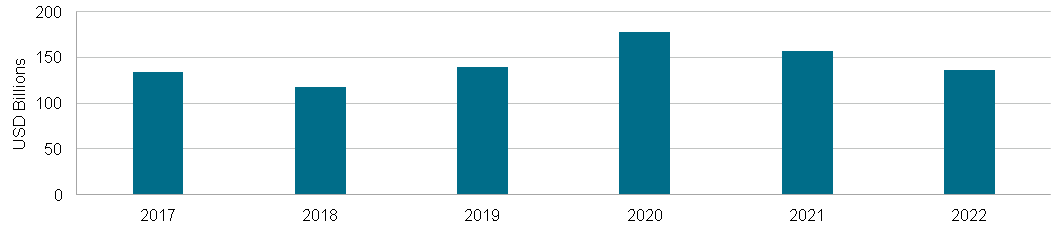
Exhibit 15: iTraxx/CDX Tranches Gross Notional Traded
Source: DTCC. Data as of Dec. 30, 2022. Index performance based on total return in USD. Past performance is no guarantee of future results. Chart is provided for illustrative purposes.
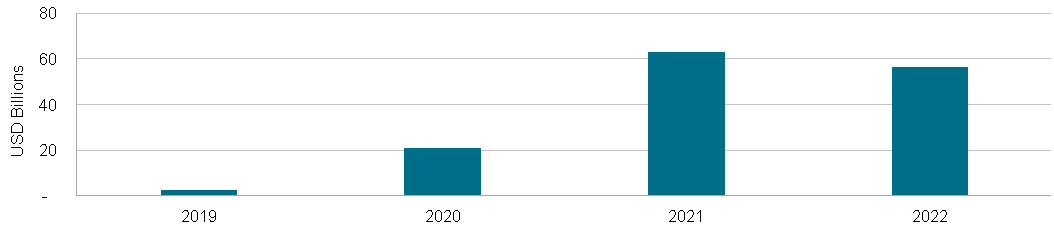
Exhibit 16: iBoxx Standardized TRS Gross Notional Traded
Source: DTCC. Data as of Dec. 30, 2022. Index performance based on total return in USD. Past performance is no guarantee of future results. Chart is provided for illustrative purposes.
Exhibit 17: iBoxx Corporate Bond Index Futures Gross Notional Traded
Source: Cboe Global Markets. Data as of Dec. 30, 2022. Index performance based on total return in USD. Past performance is no guarantee of future results. Chart is provided for illustrative purposes.
Exhibit 18: ETF Assets under Management Linked to iBoxx Indices
Source: S&P Dow Jones Indices LLC. Data as of Dec. 30, 2022. Index performance based on total return in USD. Past performance is no guarantee of future results. Chart is provided for illustrative purposes.
Register to receive S&P Dow Jones Indices’ latest research, education and commentary at on.spdji.com - SignUp
Performance Disclosure/Back-Tested Data
The iBoxx iShares $ Investment Grade Corporate Bond Index and iBoxx iShares $ High Yield Corporate Bond Index were launched May 18, 2018. All information presented prior to an index’s Launch Date is hypothetical (back-tested), not actual performance, and is based on the index methodology in effect on the index launch date. However, when creating back-tested history for periods of market anomalies or other periods that do not reflect the general current market environment, index methodology rules may be relaxed to capture a large enough universe of securities to simulate the target market the index is designed to measure or strategy the index is designed to capture. For example, market capitalization and liquidity thresholds may be reduced. In addition, forks have not been factored into the back-test data with respect to the S&P Cryptocurrency Indices. For the S&P Cryptocurrency Top 5 & 10 Equal Weight Indices, the custody element of the methodology was not considered; the back-test history is based on the index constituents that meet the custody element as of the Launch Date. Complete index methodology details are available at www.spglobal.com/spdji. Back-tested performance reflects application of an index methodology and selection of index constituents with the benefit of hindsight and knowledge of factors that may have positively affected its performance, cannot account for all financial risk that may affect results and may be considered to reflect survivor/look ahead bias. Actual returns may differ significantly from, and be lower than, back-tested returns. Past performance is not an indication or guarantee of future results.
Please refer to the methodology for the Index for more details about the index, including the manner in which it is rebalanced, the timing of such rebalancing, criteria for additions and deletions, as well as all index calculations. Back-tested performance is for use with institutions only; not for use with retail investors.
S&P Dow Jones Indices defines various dates to assist our clients in providing transparency. The First Value Date is the first day for which there is a calculated value (either live or back-tested) for a given index. The Base Date is the date at which the index is set to a fixed value for calculation purposes. The Launch Date designates the date when the values of an index are first considered live: index values provided for any date or time period prior to the index’s Launch Date are considered back-tested. S&P Dow Jones Indices defines the Launch Date as the date by which the values of an index are known to have been released to the public, for example via the company’s public website or its data feed to external parties. For Dow Jones-branded indices introduced prior to May 31, 2013, the Launch Date (which prior to May 31, 2013, was termed “Date of introduction”) is set at a date upon which no further changes were permitted to be made to the index methodology, but that may have been prior to the Index’s public release date.
Typically, when S&P DJI creates back-tested index data, S&P DJI uses actual historical constituent-level data (e.g., historical price, market capitalization, and corporate action data) in its calculations. As ESG investing is still in early stages of development, certain datapoints used to calculate S&P DJI’s ESG indices may not be available for the entire desired period of back-tested history. The same data availability issue could be true for other indices as well. In cases when actual data is not available for all relevant historical periods, S&P DJI may employ a process of using “Backward Data Assumption” (or pulling back) of ESG data for the calculation of back-tested historical performance. “Backward Data Assumption” is a process that applies the earliest actual live data point available for an index constituent company to all prior historical instances in the index performance. For example, Backward Data Assumption inherently assumes that companies currently not involved in a specific business activity (also known as “product involvement”) were never involved historically and similarly also assumes that companies currently involved in a specific business activity were involved historically too. The Backward Data Assumption allows the hypothetical back-test to be extended over more historical years than would be feasible using only actual data. For more information on “Backward Data Assumption” please refer to the FAQ. The methodology and factsheets of any index that employs backward assumption in the back-tested history will explicitly state so. The methodology will include an Appendix with a table setting forth the specific data points and relevant time period for which backward projected data was used.
Index returns shown do not represent the results of actual trading of investable assets/securities. S&P Dow Jones Indices maintains the index and calculates the index levels and performance shown or discussed but does not manage actual assets. Index returns do not reflect payment of any sales charges or fees an investor may pay to purchase the securities underlying the Index or investment funds that are intended to track the performance of the Index. The imposition of these fees and charges would cause actual and back-tested performance of the securities/fund to be lower than the Index performance shown. As a simple example, if an index returned 10% on a US $100,000 investment for a 12-month period (or US $10,000) and an actual asset-based fee of 1.5% was imposed at the end of the period on the investment plus accrued interest (or US $1,650), the net return would be 8.35% (or US $8,350) for the year. Over a three-year period, an annual 1.5% fee taken at year end with an assumed 10% return per year would result in a cumulative gross return of 33.10%, a total fee of US $5,375, and a cumulative net return of 27.2% (or US $27,200).
General Disclaimer
© 2023 S&P Dow Jones Indices. All rights reserved. S&P, S&P 500, SPX, SPY, The 500, US500 , US 30, S&P 100, S&P COMPOSITE 1500, S&P 400, S&P MIDCAP 400, S&P 600, S&P SMALLCAP 600, S&P GIVI, GLOBAL TITANS, DIVIDEND ARISTOCRATS, Select Sector, S&P MAESTRO, S&P PRISM, S&P STRIDE, GICS, SPIVA, SPDR, INDEXOLOGY, iTraxx, iBoxx, ABX, ADBI, CDX, CMBX, LCDX, MBX, MCDX, PRIMEX, TABX, HHPI, IRXX, I-SYND, SOVX, CRITS, CRITR are registered trademarks of S&P Global, Inc. (“S&P Global”) or its affiliates. DOW JONES, DJIA, THE DOW and DOW JONES INDUSTRIAL AVERAGE are trademarks of Dow Jones Trademark Holdings LLC (“Dow Jones”). These trademarks together with others have been licensed to S&P Dow Jones Indices LLC. Redistribution or reproduction in whole or in part are prohibited without written permission of S&P Dow Jones Indices LLC. This document does not constitute an offer of services in jurisdictions where S&P Dow Jones Indices LLC, S&P Global, Dow Jones or their respective affiliates (collectively “S&P Dow Jones Indices”) do not have the necessary licenses. Except for certain custom index calculation services, all information provided by S&P Dow Jones Indices is impersonal and not tailored to the needs of any person, entity or group of persons. S&P Dow Jones Indices receives compensation in connection with licensing its indices to third parties and providing custom calculation services. Past performance of an index is not an indication or guarantee of future results.
It is not possible to invest directly in an index. Exposure to an asset class represented by an index may be available through investable instruments based on that index. S&P Dow Jones Indices does not sponsor, endorse, sell, promote or manage any investment fund or other investment vehicle that is offered by third parties and that seeks to provide an investment return based on the performance of any index. S&P Dow Jones Indices makes no assurance that investment products based on the index will accurately track index performance or provide positive investment returns. S&P Dow Jones Indices LLC is not an investment advisor, and S&P Dow Jones Indices makes no representation regarding the advisability of investing in any such investment fund or other investment vehicle. A decision to invest in any such investment fund or other investment vehicle should not be made in reliance on any of the statements set forth in this document. S&P Dow Jones Indices is not an investment adviser, commodity trading advisor, commodity pool operator, broker dealer, fiduciary, promoter” (as defined in the Investment Company Act of 1940, as amended), “expert” as enumerated within 15 U.S.C. § 77k(a) or tax advisor. Inclusion of a security, commodity, crypto currency or other asset within an index is not a recommendation by S&P Dow Jones Indices to buy, sell, or hold such security, commodity, crypto currency or other asset, nor is it considered to be investment advice or commodity trading advice.
These materials have been prepared solely for informational purposes based upon information generally available to the public and from sources believed to be reliable. No content contained in these materials (including index data, ratings, credit-related analyses and data, research, valuations, model, software or other application or output therefrom) or any part thereof (“Content”) may be modified, reverse-engineered, reproduced or distributed in any form or by any means, or stored in a database or retrieval system, without the prior written permission of S&P Dow Jones Indices. The Content shall not be used for any unlawful or unauthorized purposes. S&P Dow Jones Indices and its third-party data providers and licensors (collectively “S&P Dow Jones Indices Parties”) do not guarantee the accuracy, completeness, timeliness or availability of the Content. S&P Dow Jones Indices Parties are not responsible for any errors or omissions, regardless of the cause, for the results obtained from the use of the Content. THE CONTENT IS PROVIDED ON AN “AS IS” BASIS. S&P DOW JONES INDICES PARTIES DISCLAIM ANY AND ALL EXPRESS OR IMPLIED WARRANTIES, INCLUDING, BUT NOT LIMITED TO, ANY WARRANTIES OF MERCHANTABILITY OR FITNESS FOR A PARTICULAR PURPOSE OR USE, FREEDOM FROM BUGS, SOFTWARE ERRORS OR DEFECTS, THAT THE CONTENT’S FUNCTIONING WILL BE UNINTERRUPTED OR THAT THE CONTENT WILL OPERATE WITH ANY SOFTWARE OR HARDWARE CONFIGURATION. In no event shall S&P Dow Jones Indices Parties be liable to any party for any direct, indirect, incidental, exemplary, compensatory, punitive, special or consequential damages, costs, expenses, legal fees, or losses (including, without limitation, lost income or lost profits and opportunity costs) in connection with any use of the Content even if advised of the possibility of such damages.
S&P Global keeps certain activities of its various divisions and business units separate from each other in order to preserve the independence and objectivity of their respective activities. As a result, certain divisions and business units of S&P Global may have information that is not available to other business units. S&P Global has established policies and procedures to maintain the confidentiality of certain non-public information received in connection with each analytical process.
In addition, S&P Dow Jones Indices provides a wide range of services to, or relating to, many organizations, including issuers of securities, investment advisers, broker-dealers, investment banks, other financial institutions and financial intermediaries, and accordingly may receive fees or other economic benefits from those organizations, including organizations whose securities or services they may recommend, rate, include in model portfolios, evaluate or otherwise address.
Disclaimer:
The views, thoughts and opinions contained in this Focus article belong solely to the author and do not necessarily reflect the WFE’s policy position on the issue, or the WFE’s views or opinions.