Twenty years of market capitalisation: the statistical properties of a flagship WFE indicator
WFE statistics are an important asset for the WFE. They are widely used among researchers, practitioners, journalists and other stakeholders; they are frequently cited in news, reports and academic papers. Given the crucial role the production and dissemination of statistics plays in the WFE value proposition, we believe the WFE team should also provide insights into the statistical properties of our indicators. This piece focuses on a flagship one: equity market capitalisation. This article is intended to review how this indicator can be analysed and/or implemented in wider analyses based on its statistical properties.
To study the statistical properties of equity market capitalisation we obtained monthly time series for the period January 2000 – December 2019 (twenty years of data, for a maximum of 240 observations) for all exchanges reported by the WFE. We collected a total of 114 time series. Sample sizes varied between exchanges as several markets started reporting at a later date. To ensure accuracy of our statistical analyses, we retained time series for exchanges that have at least five years of data (60 observations). This left us with 90 individual time series. We further excluded exchanges the statistics of which were subsequently consolidated into broader exchange group statistics (such as those for individual exchanges comprising Nasdaq Nordic or Euronext), which left us with 75 individual time series. We analysed time series in local currency (as opposed to USD) to avoid considering exchange rate dynamics into the analyses.
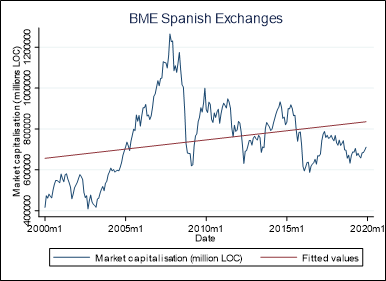
The first step in our analysis was to perform a visual inspection of time series plots to infer their statistical properties. A visual inspection allowed us to conclude that most individual time series were characterised by a clear linear trend, either positive or negative (Group 1). A smaller group of exchanges (generally located in Europe) did not show any clear linear trend in their time series (Group 2). Occasionally, time series were characterised by structural breaks [1] likely due to changes in market or macroeconomic conditions, though they could typically be bucketed in either Group 1 or 2. A time series pattern from each group is reported below:
Figure 1: Time series pattern of an exchange from Group 1 (with a linear trend)
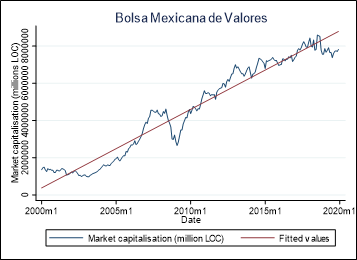
Figure 2: Time series pattern of an exchange from Group 2 (without a linear trend)
After having visually inspected the data, we decided to determine whether the individual time series of market capitalisation are stationary (i.e. oscillating around a finite mean) or characterised by a unit root (i.e., at a basic level, their mean changes over time). This is important as the statistical properties of a non-stationary time series are different from usual: for example, first and second moments (the mean and the variance) of non-stationary time series cannot be computed in a meaningful way, while correlation and regression analyses between non-stationary time series have a misleading interpretation. To meaningfully study the relation between time series characterised by non-stationarity, one has to perform different kinds of analyses (i.e. cointegration).
To conclude whether our time series were stationary, we compared and contrasted three different statistical tests: the augmented Dickey-Fuller test, the Phillips-Perron test, and the GLS Dickey Fuller test. Given that time series of market capitalisation were likely to be autocorrelated (i.e. this month’s value might be correlated with the previous months’ values), and that this correlation could influence the results of the tests, we introduced past values of the series in the tests to take this correlation into account. To choose the number of past values (lags) we ran another statistical test. [2] In many cases, the test suggested that the number of past values to be introduced in the unit root tests was equal to one.
The test results are displayed in Table 1 below:
| Exchange | Observations | Trend | Chosen lag (AIC) | Result |
|---|---|---|---|---|
| ASX Australian Securities Exchange | 238 | Yes | 1 | Unit root with a trend |
| Abu Dhabi Securities Exchange | 92 | No | 1 | Unit root no trend |
| Amman Stock Exchange | 136 | Yes | 7 | Unit root with a trend |
| Athens Stock Exchange | 226 | No | 1 | Unit root no trend |
| B3 | 234 | Yes | 5 | Unit root with a trend |
| BME Spanish Exchanges | 238 | No | 1 | Unit root no trend |
| BRVM | 70 | Yes | 1 | Unit root with a trend |
| BSE India Limited | 201 | Yes | 2 | Unit root with a trend |
| Bahrain Bourse | 54 | Yes | 5 | Unit root with a trend |
| Barbados Stock Exchange | 63 | Yes | 4 | Unit root with a trend |
| Beirut Stock Exchange | 65 | Yes | 1 | Unit root with a trend |
| Bermuda Stock Exchange | 188 | No | 1 | Unit root no trend |
| Bolsa Mexicana de Valores | 238 | Yes | 1 | Unit root with a trend |
| Bolsa Nacional de Valores | 70 | No | 1 | Unit root no trend |
| Bolsa de Comercio de Santiago | 238 | No | 1 | Unit root no trend |
| Bolsa de Valores de Colombia | 178 | No | 1 | Unit root no trend |
| Bolsa de Valores de Lima | 237 | Yes | 2 | Unit root with a trend |
| Bolsa de Valores de Panama | 70 | Yes | 1 | Unit root with a trend |
| Bolsa y Mercados Argentinos | 225 | Yes | 14 | Unit root with a trend |
| Borsa Istanbul | 195 | Yes | 8 | Unit root with a trend |
| Bourse de Casablanca | 106 | Yes | 2 | Unit root with a trend |
| Bucharest Stock Exchange | 94 | Yes | 1 | Unit root with a trend |
| Budapest Stock Exchange | 212 | No | 3 | Unit root no trend |
| Bursa Malaysia | 238 | Yes | 1 | Unit root with a trend |
| CEESG - Vienna | 235 | No | 4 | Unit root no trend |
| Chittagong Stock Exchange | 70 | No | 1 | Unit root no trend |
| Colombo Stock Exchange | 238 | Yes | 1 | Unit root with a trend |
| Cyprus Stock Exchange | 154 | No | 13 | Unit root with a trend |
| Deutsche Boerse AG | 237 | Yes | 1 | Unit root with a trend |
| Dhaka Stock Exchange | 70 | No | 1 | Unit root no trend |
| Dubai Financial Market | 62 | No | 9 | Unit root no trend |
| Euronext | 226 | Yes | 1 | Unit root with a trend |
| Euronext Dublin | 224 | No | 4 | Unit root no trend |
| Hanoi Stock Exchange | 70 | No | 1 | Unit root no trend |
| Hochiminh Stock Exchange | 77 | Yes | 6 | Unit root with a trend |
| Hong Kong Exchanges and Clearing | 238 | Yes | 1 | Stationary around a trend |
| Indonesia Stock Exchange | 236 | Yes | 1 | Unit root with a trend |
| Jamaica Stock Exchange | 67 | Yes | 4 | Unit root with a trend |
| Japan Exchange Group | 70 | No | 1 | Unit root no trend |
| Johannesburg Stock Exchange | 228 | Yes | 10 | Unit root with a trend |
| Kazakhstan Stock Exchange | 106 | Yes | 1 | Unit root with a trend |
| Korea Exchange | 238 | Yes | 1 | Unit root with a trend |
| LSE Group | 130 | Yes | 1 | Unit root with a trend |
| Luxembourg Stock Exchange | 233 | No | 6 | Unit root no trend |
| Malta Stock Exchange | 118 | Yes | 1 | Unit root with a trend |
| Moscow Exchange | 93 | Yes | 2 | Unit root with a trend |
| Muscat Securities Market | 118 | No | 1 | Unit root no trend |
| NYSE | 227 | No | 11 | Unit root with a trend |
| NZX Limited | 94 | Yes | 1 | Unit root with a trend |
| Nasdaq - US | 229 | Yes | 10 | Unit root with a trend |
| Nasdaq Nordic and Baltics | 178 | Yes | 1 | Unit root with a trend |
| National Stock Exchange of India | 201 | Yes | 2 | Unit root with a trend |
| Nigerian Stock Exchange | 70 | No | 1 | Unit root no trend |
| Oslo Bors | 236 | Yes | 3 | Unit root with a trend |
| Palestine Exchange | 82 | Yes | 1 | Unit root with a trend |
| Philippine Stock Exchange | 235 | Yes | 4 | Unit root with a trend |
| Qatar Stock Exchange | 82 | No | 1 | Unit root no trend |
| SIX Swiss Exchange | 238 | Yes | 1 | Unit root with a trend |
| Saudi Stock Exchange (Tadawul) | 124 | Yes | 7 | Unit root with a trend |
| Shanghai Stock Exchange | 202 | Yes | 1 | Unit root with a trend |
| Shenzhen Stock Exchange | 200 | Yes | 3 | Unit root with a trend |
| Singapore Exchange | 238 | No | 1 | Unit root no trend |
| Stock Exchange of Mauritius | 164 | Yes | 3 | Unit root with a trend |
| TMX Group | 238 | Yes | 1 | Unit root with a trend |
| Taipei Exchange | 94 | Yes | 1 | Unit root with a trend |
| Taiwan Stock Exchange | 238 | Yes | 1 | Unit root with a trend |
| Tehran Stock Exchange | 227 | No | 12 | Unit root no trend |
| Tel-Aviv Stock Exchange | 237 | No | 2 | Unit root no trend |
| The Egyptian Exchange | 166 | No | 1 | Unit root no trend |
| The Stock Exchange of Thailand | 238 | Yes | 1 | Unit root with a trend |
| Tunis Stock Exchange | 71 | Yes | 1 | Unit root with a trend |
| Ukrainian Exchange | 65 | Yes | 1 | Unit root with a trend |
| Warsaw Stock Exchange | 235 | No | 4 | Unit root no trend |
| Zagreb Stock Exchange | 69 | Yes | 2 | Unit root with a trend |
As evident from Table 1, market capitalisation was overwhelmingly characterised by a unit root. The only time series for which the unit root hypothesis was rejected is Hong Kong Exchanges and Clearing, for which the null of a unit root was rejected at the 10% level.
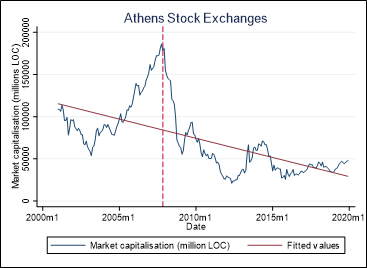
The academic literature has pointed out that in presence of structural breaks, traditional unit root tests might perform poorly. Given that our time series contained the global financial crisis, we were mindful that structural breaks might affect our results. We therefore cross-checked our results against the Clemente, Montanes and Reyes unit root test, which accounts for the presence of up to two structural breaks, and the Zivot and Andrews test, which accounts for the presence of one structural break. While the tests allowed us to detect the presence of structural breaks (see figure 3 below), we found that our times series are overwhelmingly characterised by unit roots.
Figure 3: Structural break in the Athens Stock Exchange
This result should be kept in mind when computing first and second moments (the mean and the variance) of the series, or when performing correlation analyses between those series, given that the computation of all these statistics would be meaningless in the presence of non-stationarity. To correctly utilise market capitalisation statistics, users should take the first difference or the log difference of this indicator, which would likely be stationary and hence characterised by the usual statistic properties [3] or perform analyses that are appropriate for non-stationary time series (cointegration).
___________________________________________________________________________________________________________________________________________________________________________
[1] A structural is an unexpected change in the intercept term or the slope coefficient of a regression model.
[2] We chose the autoregressive model that minimises the Akaike Information Criterion.
[3] This is true if the series is integrated of order one. While this typically turns out to be true for most financial stochastic processes, in principle one should test stationarity on the differentiated series as well.