Currency derivatives
In this article we analyse the trends in currency derivatives in H1 2021 compared to 2020. Currency derivatives include futures and option contracts with the foreign exchange rate between two currencies as the underlying reference rate.
The data is taken from the WFE Statistics Portal and it represents the globally aggregated figures.
The number of currency derivatives contracts traded in H1 2021 was 2.22 billion, which was a 5.1% increase on H2 2020 and a 30.2% increase on H1 2020.
In H1 2021 futures accounted for 72% of all currency contracts traded, while options only for 28%.
Quarter-on-quarter, Q1 2021 witnessed a 4% increase compared to Q4 2020 to 1.12 billion contracts traded, while Q2 2021 registered a 1.9% drop (to 1.10 billion contracts traded) compared to Q1 2021.
In March 2020 we observed an exceptional 53.4% month-on-month increase in currency derivatives contracts traded, due to COVID-19 related uncertainty. Another pronounced peak is observed in March 2021, which represents 32.6% month-on-month increase, due mostly to the Americas and EMEA regions.
After the peak in March 2020, we observed a pronounced increase for the rest of the year compared to pre-pandemic levels, due to all regions. This pattern continued in the first three months of 2021, after a decrease in January 2021.
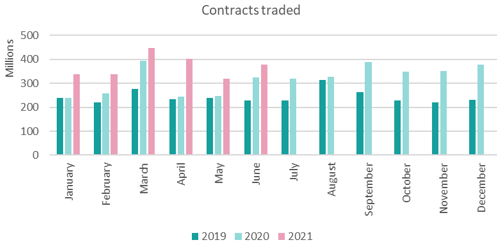
Figure 1: Number of currency derivatives contracts traded between Jan 2019 – Jun 2021
In H1 2021 currency options volumes went up by 29.7% to 612 million, while currency futures volumes decreased by 1.9% to 1.61 billion compared to H2 2020.
Compared to H1 2020, in H1 2021 both futures and options volumes went up by 21.9% and 58.4% respectively.
The decrease in number of futures contracts traded in H1 2021 compared to H2 2020 was due to the Americas and EMEA regions, which decreased by 6.9% and 5.0% respectively, while APAC recorded an increase of 8.9%.
In H1 2021, futures contracts were traded almost equally in each region: the Americas (37%), APAC (30%) and EMEA accounts for the rest of 33%.
The futures contracts traded in H1 2021 compared to H1 2020 increased in all regions: the Americas by 24.4%, APAC by 12.9% and EMEA region by 28.4%.
Exchanges with an excellent performance in H1 2021 compared to H2 2020 were National Stock Exchange of India (9.9%), Singapore Exchange (18.5%), Bolsa Mexicana de Valores (28.3%), ICE Futures US (13.4%), Budapest Stock Exchange (31.1%), Hong Kong Exchanges and Clearing (26.5%) and Bolsa de Valores de Colombia (43.5%).
Quarter-on-quarter, Q1 2021 witnessed a 1.0% increase in futures volumes compared to Q4 2020, entirely due to the APAC region (+8.9%), while the Americas and EMEA decreased by 0.8% and 3.3% respectively.
In Q2 2021 the situation changed, futures volumes fell by 10.7% compared to Q1 2021, caused by all regions declining: the Americas by 7.4%, APAC by 7.6% and EMEA by 17.1%.
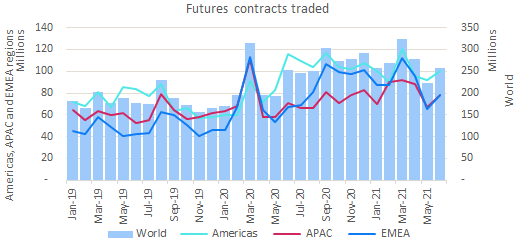
Figure 2: Number of currency futures contracts traded between Jan 2019 – Jun 2021
The increase in number of options contracts traded in H1 2021 compared to H2 2020 was due entirely to the APAC region, which went up by a significant 32.7% while the Americas and EMEA regions recorded decreases of 11.4% and 5.8%, respectively.
Unlike the almost equal distribution of futures contracts, options contracts are traded mostly in APAC (94%), while the Americas and EMEA account for the rest of 1% and 5% share, respectively.
Year on year, in H1 2021 the increase in options contracts traded was towed by the APAC region, which performed very well, increasing by 69.0%. We notice the opposite in the Americas and EMEA, regions which went down by 30.6% and 20.7% respectively.
Exchanges with a good performance in H1 2021 compared to H2 2020 were National Stock Exchange of India (32.7%), CME Group (1.1%), Bourse de Montreal (8.7%) and Matba Rofex (41.7%).
Quarter-on-quarter, Q1 2021 witnessed a 14.6% increase in options volumes compared to Q4 2020, entirely due to the APAC region (+16.0%), while the Americas and EMEA decreased by 4.3% and 1.1% respectively.
The growth continued in Q2 2021, options volumes going up by 26.0% compared to Q1 2021, due to APAC region which increased by 28.7%, while the Americas and EMEA regions fell by 12.1% and 11.3% respectively.
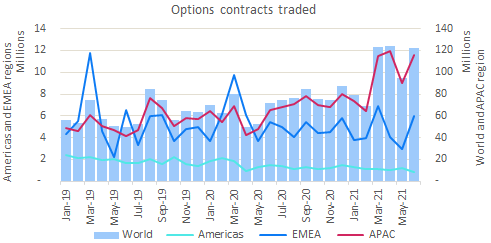
Figure 3: Number of currency options contracts traded between Jan 2019 – Jun 2021
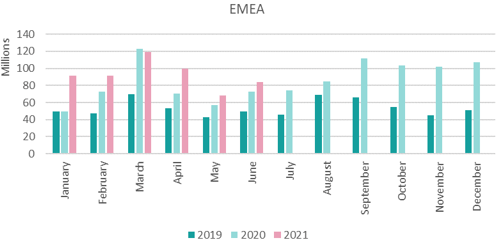
The number of currency derivatives traded in each region is illustrated in Figures 4-6.
Figure 4: Number of currency derivatives contracts traded in the Americas between Jan 2019 – Jun 2021
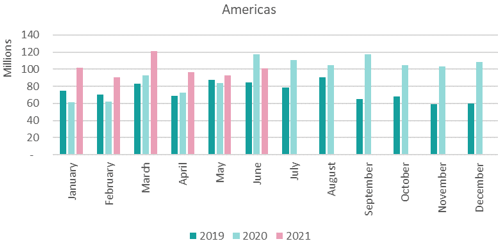
Figure 5: Number of currency derivatives contracts traded in APAC between Jan 2019 – Jun 2021
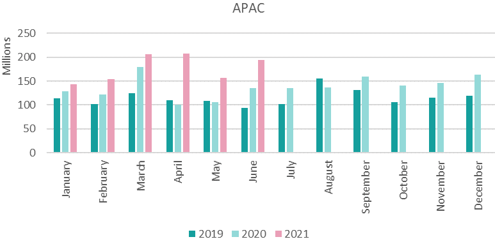
Figure 6: Number of currency derivatives contracts traded in EMEA between Jan 2019 – Jun 2021