Equity number of trades Electronic Order Book (EOB)
In this article, we analyse the trend in equity trading activities, measured by the number of trades that took place in the exchanges’ Electronic Order Book (EOB) in 2021 compared to 2020.
The data is taken from the WFE Statistics Portal. The definition of our indicators can be found in WFE Definitions Manual.
In 2021 there were 48.89 billion trades in equity shares, which represented 27.6% increase on 2020. This result was due to the Americas and APAC regions which rose 30.9% and 31.1%, while EMEA declined 6.9%.
63% of trades took place in APAC, 30% in the Americas and the rest (7%) in EMEA.
26.79 billion trades took place in H2 2021, a 21.2% increase on H1 2021. This result was due to the Americas and APAC regions rising 27% and 21.3% respectively, while EMEA recorded 2.6% fewer trades.
When comparing H2 2021 with H2 2020, the number of trades EOB increased 33.3%, with the Americas and APAC regions registering 56.4% and 30% more trades, respectively, while EMEA witnessed 11.3% fewer trades.
Figure 1: Equity number of trades EOB between Jan 2019 – Dec 2021
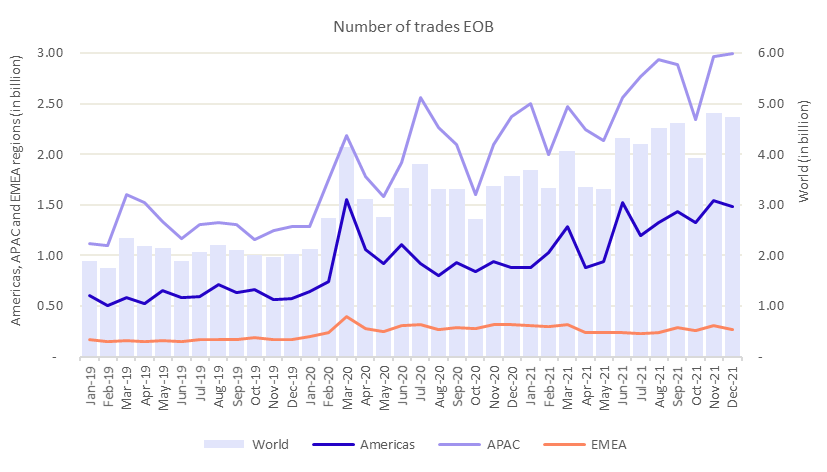
In Q4 2021 the number of trades rose 1.2% compared to Q3 2021, amounting to 13.47 billion trades, which is the quarter with the highest number of trades in the last three years. The Americas and EMEA regions contributed to this result, going up 9.7% and 8.6%, respectively, while APAC region fell 3.5%. Exchanges that performed well during this period of time were: Dubai Financial Market (161.6%), National Equities Exchange and Quotations (115.5%), Abu Dhabi Securities Exchange (71.9%), Borsa Istanbul (47.1%), Nasdaq-US (13.4%), Cboe Global Markets (9.4%), NYSE (5.7%), National Stock Exchange of India (4.8%) etc.
When comparing Q4 2021 with Q4 2020, the increase is more pronounced (39.4%). This performance was possible due to the Americas and APAC regions increasing 62.9% and 36.6%, respectively, while EMEA region declined 10.1%.
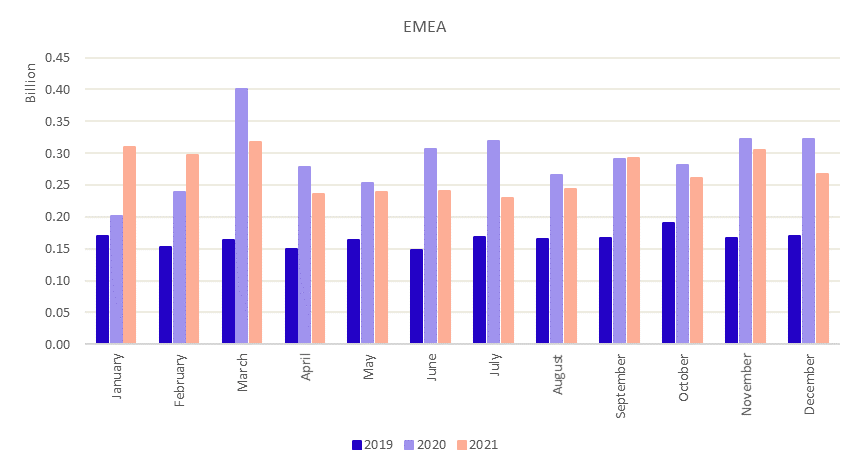
In December 2021 APAC region recorded its highest number of trades in the last three years (3 billion), while the maximum for the Americas and EMEA regions was recorded in March 2020 with 1.55 billion and 400.55 million trades, respectively.
The regional value traded EOB total is illustrated in Figures 2-4.
Figure 2: Equity number of trades EOB between Jan 2019 – Dec 2021 in the Americas region
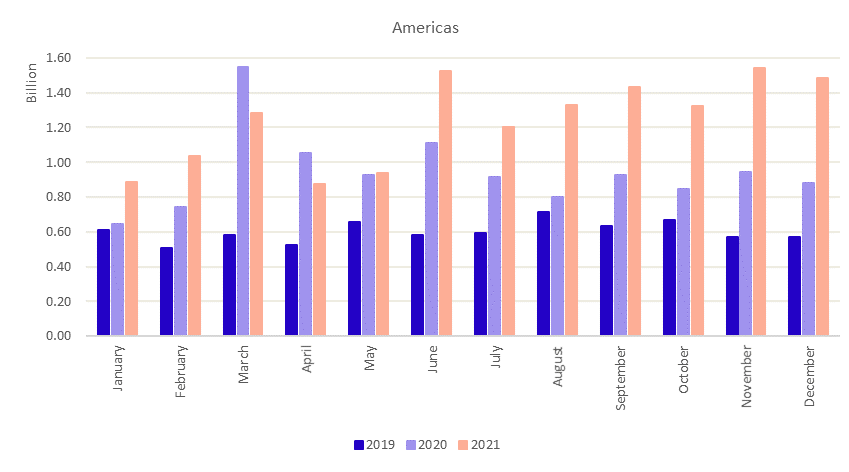
Figure 3: Equity number of trades EOB between Jan 2019 – Dec 2021 in the APAC region

Figure 4: Equity number of trades EOB between Jan 2019 – Dec 2021 in the EMEA region