ETFs - number of trades
In this article, we analyse the trends in ETFs number of trades in recent years. To achieve a more complete view of market activity, the trades are split according to the facility/means used to execute the trade, namely Electronic Order Book (EOB) and Negotiated Deals.
The data is available on the WFE Statistics Portal, while the indicators are defined in our Definitions Manual. For questions or feedback about this article, please contact the WFE Statistics Team at [email protected]
The number of trades in ETFs globally in 2021 was 2.53 billion, up 26.8% from 2020. Trade activity in all regions increased: the Americas increased 2.9%, the APAC region increased 56.4%, and the EMEA region increased 164.2%.
In the first half of 2022, the volume of trades reached 2.42 billion, with the Americas accounting for the largest share of the trading activity (63%), followed by regions in APAC (31%), and EMEA (7%) (Figure 1).
Figure 1: ETFs number of trades between Jan 2020 – Aug 2022

In H1 2022, the ETF volumes went up 36.2% compared to the previous six-month period, amounting to 1.85 billion trades. While the EMEA declined 25.6%, The Americas and APAC regions rose 65.9% and 14.1%, respectively. When comparing H1 2022 with H1 2021, we notice an even more pronounced increase of 58.2%, due to all regions going up: the Americas 80.9%, APAC 35.5% and EMEA region 9.8%.
Despite the overall increase with respect to the previous year, the data suggests a change in trend in March 2022, with the decrease in total volumes coinciding with the war in Ukraine and spiralling global inflation.
Year-to-date (Jan - Aug 2022) the following exchanges have reported the highest volumes of ETF trades: Nasdaq-US (896.33 million trades), Shanghai Stock Exchange (222.47 million trades), and Korea Exchange (134.41 million trades).
In Q2 2022 ETF volumes decreased 5.5% compared to the previous quarter, amounting to 900.66 million trades, with the Americas and EMEA regions recording declines of 9.4% and 19.1%, respectively, while APAC region experienced a 6.9% increase.
When comparing Q2 2022 with Q2 2021, a substantial 64.1% increase is noticed, due to the Americas and APAC regions rising 84.8% and 53.4%, respectively, while the EMEA region fell 7.3%.
The ETF volumes by region are illustrated in Figures 2-4.
Figure 2: ETFs number of trades between Jan 2020 – Aug 2022 in the Americas region
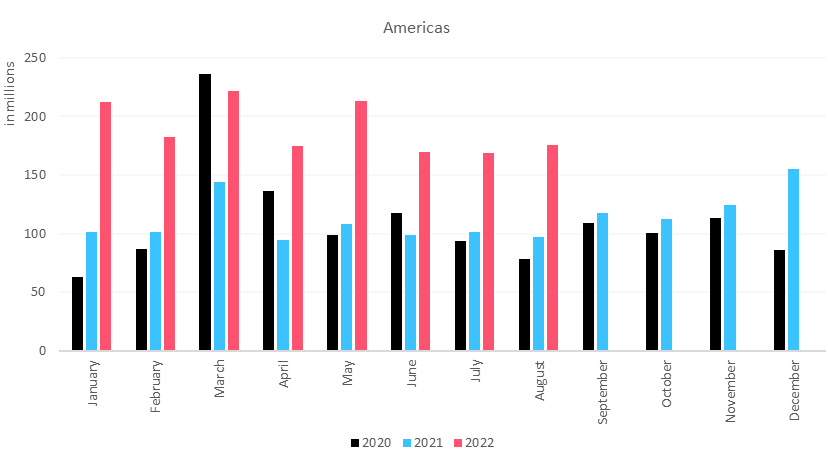
Figure 3: ETFs number of trades between Jan 2020 – Aug 2022 in the APAC region

Figure 4: ETFs number of trades between Jan 2020 – Aug 2022 in the EMEA region

With regards to the split between EOB and negotiated deals, year-to-date (Jan-Aug 2022) there were 1.95 billion trades through EOB (81% share) and 466.9 million trades through negotiated deals (19% share).
Figures 6 - 7 present the evolution of ETF volumes through EOB and negotiated deals between Jan 2020 – Aug 2022. There may be a discrepancy between the total volume and the sum of volume through EOBs and negotiated deals because some exchanges cannot provide the breakdown.
Figure 5: ETFs number of trades EOB and negotiated deals between Jan 2020 – Aug 2022

Figure 6: ETFs number of trades EOB between Jan 2020 – Aug 2022

Figure 7: ETFs number of trades negotiated deals between Jan 2020 – Aug 2022
