Exchange-traded funds trends in 2020
2020 was an eventful year, with a global pandemic, lockdowns and travel restrictions imposed globally, the upcoming US presidential election and Brexit. Towards the end of the year the news of development and approval of several vaccines, the finalisation of a Brexit deal between the UK and the EU and the outcome of the US elections gave investors much needed confidence and markets ended the year on a high note. Global stock market capitalisation at the end of 2020 was up by a fifth as compared to the end of 2019. In November 2020, markets added 10.90 trillion USD, surpassing the 100 trillion USD mark for the first time in history (at 104.12 trillion USD). Compared to the previous year, 2020 saw record-high levels of value traded (up 53.7%) and volumes traded (up 56.0%).
The positive end-of-year stock market sentiment is reflected in the ETF market too. ETFs are a popular way of investing in the stock market as they trade like stocks but provide investors with low-cost access to various asset classes and industry sectors, thus allowing investors to diversify risk. As a consequence, we expect the two markets to be highly correlated.
In this article we look at the trends in ETF1 in 2020 and we compare them to the previous year for a more complete picture.
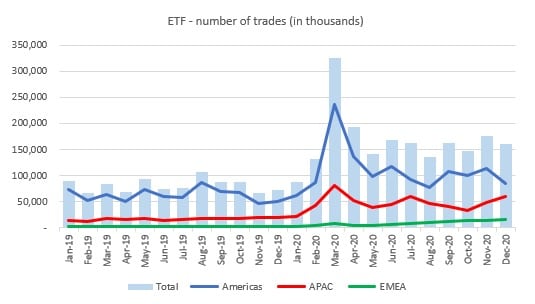
The number of trades in 2020 more than doubled (104%) compared to 2019, due to the increase of activity in all regions. Americas registered an uptrend of 75.3%, APAC of 183.6% and EMEA a dramatic 326.6%.
Quarter on quarter in 2020 the volume had a mixed trend. If in Q1 we notice a significant increase of 139.8%, due to upticks in all regions. In Q2 and Q3 volumes fell by 7.6% and 8.9% respectively, while in Q4 it registered an increase of 5.5%. America has the lion’s share of ETF volumes (66%).
The value traded in Q1 more than doubled compared to Q4 2019, but the average trade size was smaller than the previous quarter.
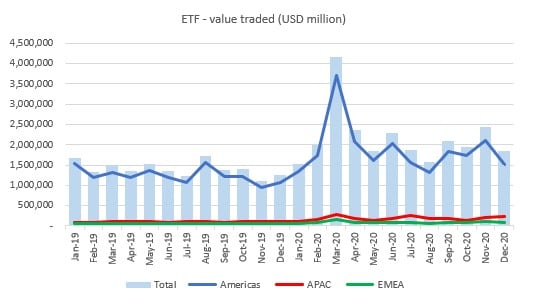
ETF value traded also increased in 2020 compared to the previous year by 54%, reaching 25.9 trillion USD, due to a strong performance in all regions: the Americas – where 87.2% of the value is traded - was up by 51.6% in 2020, APAC by 85.1% and EMEA by 51.6%.
Quarter on quarter in 2020, the value traded increased in Q1 by 104.8%, but with the deepening of the pandemic, fell in Q2 by 15.4%. In Q3 continued to fall by 14.6%. Possibly due to the outcome of the US presidential elections and the news of several vaccines being approved, the value traded in Q4 went up by 12.3% on the previous quarter, standing at 6.2 trillion USD.
November witnessed the highest value traded in H2 2020 of Nasdaq-US and Cboe Global Markets combined (2.1 trillion USD).
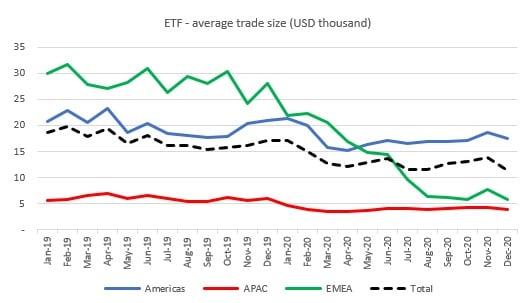
The average trade size was 24.5% smaller in 2020 compared to 2019 (standing at 12,968 USD/trade). This trend was noticed in all regions: the Americas (13.5%), APAC (34.7%), while EMEA decreased by a significant 64.5%.
If in 2019 the average trade size was considerably higher in EMEA (28,478 USD/trade) than in the Americas (19,806), in 2020 the roles reversed: the average trade size in the Americas was 17,122 while in the EMEA only 10,123 USD/trade.
Quarter on quarter in 2020 the EMEA was the only region to experience a decrease of the average trade size every quarter. Globally in Q1 the average trade size declined by 14.6%, this trend continued in Q2 and Q3 by 8.4% and 6.3% respectively, while in Q4 it went up by 6.5%, entirely due to the Americas region, showing that investors started gaining confidence.
_______________
1For Americas not included NYSE data.