IPOs during the coronavirus pandemic
In this article we look at the number of IPOs and the investment flows they funnelled to the underlying economies during January-June 2020, thus highlighting the important role of stock exchanges as a funding mechanism.
As Figure 1 shows, the number of IPOs at the beginning of 2020 went down every month, to then register a dramatic increase in June to 103 listings. This represents a 114.6% increase compared to May, which registered the lowest number of IPOs this year, and a 32.1% increase with respect to January. The aggregate number of IPOs listed in the first half of 2020 is comparable with the same period in 2019 when 521 IPOs were listed globally.
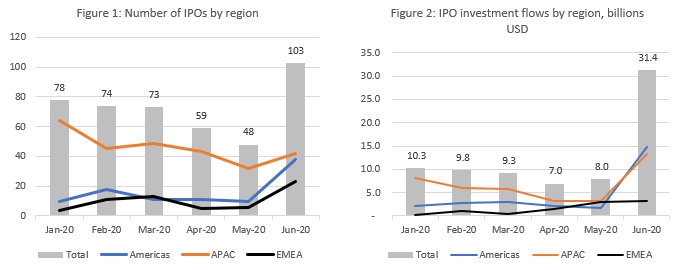
As we observe in Figure 2, the IPO investment flows also followed a downtrend in the first four months of the year. April saw the lowest levels of investment flows with 7.0 billion USD globally, but increased in May by 14.2% to 8.0 billion USD and more dramatically in June by 294% on May to 31.4 billion USD, mostly due to some very large IPOs on Hong Kong Exchanges and Clearing, Nasdaq-US and LSE Group
The capital raised globally in the first half of 2020 was comparable with the same period of the previous year (72.2 billion USD).
Table 1: Month by month change in the number of IPOs
|
Region |
%change Feb/Jan |
%change Mar/Feb |
%change Apr/Mar |
%change May/Apr |
%change Jun/May |
|
Americas |
80.0% |
-38.9% |
0.0% |
-9.1% |
280.0% |
|
APAC |
-29.7% |
8.9% |
-12.2% |
-25.6% |
31.3% |
|
EMEA |
175.0% |
18.2% |
-61.5% |
20.0% |
283.3% |
|
Total |
-5.1% |
-1.4% |
-19.2% |
-18.6% |
114.6% |
Table 2: Month on month change in the capital raised by IPOs
|
Region |
% change Feb/Jan |
% change Mar/Feb |
% change Apr/Mar |
% change May/Apr |
% change Jun/May |
|
Americas |
36.0% |
7.2% |
-25.6% |
-26.9% |
805.3% |
|
APAC |
-26.5% |
-3.3% |
-42.9% |
-1.0% |
310.7% |
|
EMEA |
593.1% |
-53.0% |
196.7% |
113.1% |
3.0% |
|
Total |
-5.0% |
-5.5% |
-24.7% |
14.2% |
294.1% |
From Table 3 we notice that, globally, the capital raised per listing also increased in June to 304.69 million USD, a 83.6% increase with respect to May, which means that June IPOs were significantly larger than previous months (except in EMEA, which hosted the largest IPOs in May).
Table 3: Capital raised per listing (million USD)
|
Region |
Jan-20 |
Feb-20 |
Mar-20 |
Apr-20 |
May-20 |
Jun-20 |
|
Americas |
206.98 |
156.43 |
274.53 |
204.31 |
164.24 |
391.27 |
|
APAC |
126.40 |
132.06 |
117.32 |
76.35 |
101.58 |
317.88 |
|
EMEA |
37.29 |
93.97 |
37.37 |
288.23 |
511.79 |
137.57 |
|
Total |
132.16 |
132.32 |
126.77 |
118.16 |
165.91 |
304.69 |
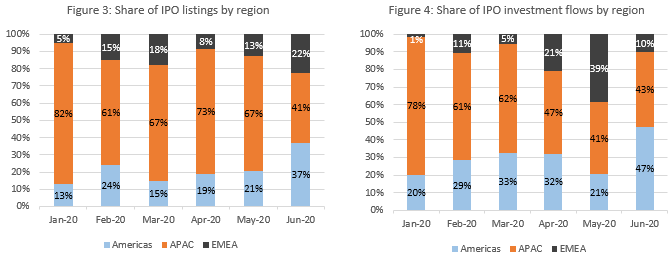
In Figure 3 we notice that the APAC region consistently had the highest monthly share of IPO listings. The APAC region also attracted the largest share of investment flows, except in June, when Americas registered the largest share of IPO investments, as shown in Figure 4.
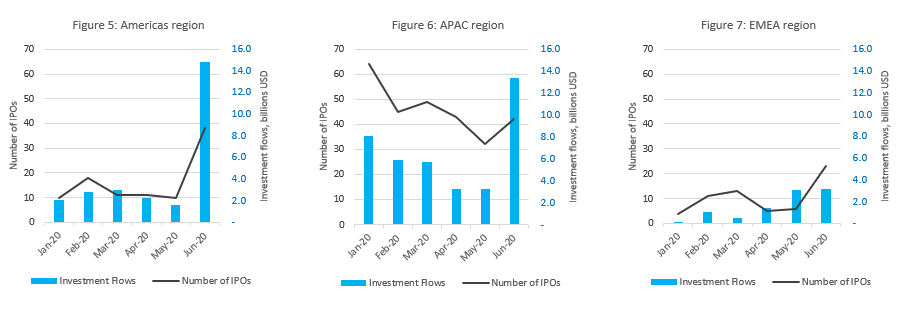
At regional level, the trends in numbers of IPO and investment flows were mixed as shown in Figures 5-7, with June being a particularly good month for all three regions, with both higher numbers of IPOs and higher investment flows. In EMEA, some larger IPOs took place in April and May. The largest IPO of the region this year was Royal Pharma (Nasdaq-US) which raised 2.2 billion USD in June. Other large June IPOs on the same exchange were Warner Music Group (1.9 billion USD) and ZoomInfo Technologies (0.9 billion USD).
In APAC region, Hong Kong Exchanges and Clearing hosted JD.com (the largest IPO this year) and NetEase Inc which raised 4.5 and 3.1 billion USD respectively.
In EMEA, LSE Group listed China Pacific Insurance Group and Italian Filter Maker GVS in June raising 2 and respectively 0.6 billion USD.