Q3 2019 equity markets update
Equity markets
Total Market Capitalisation January - September 2019
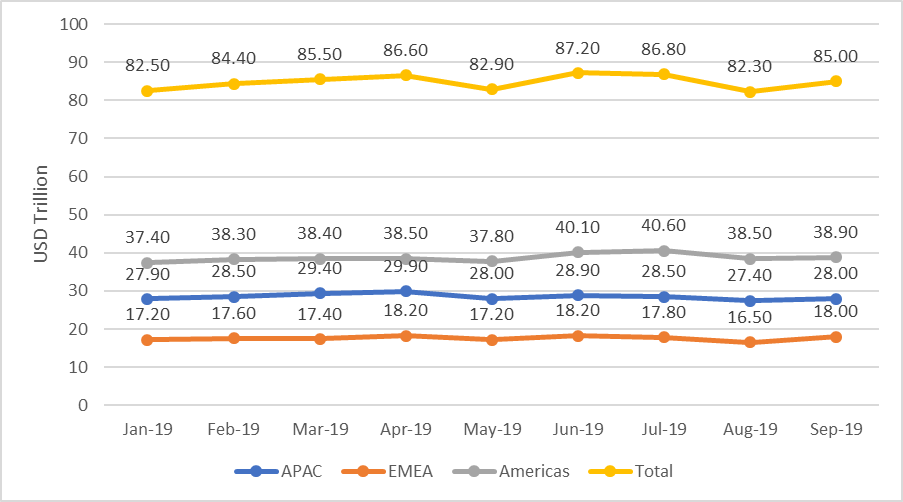
- Domestic market capitalisation amounted to USD85 trillion as at the end of September 2019.
- Total market capitalisation dropped slightly by 2.7% year-on-year.
- In September, total market capitalisation regained value after the drop in August. EMEA is the region that experienced a larger proportion of drop in value in August.
- Value of trades in equity shares in Q3 amounted to USD22 trillion, an increase of 5.1% compared to Q3 2018, but the lowest among the three quarters in 2019. Total value of trades in the first three quarters amounted to USD68.5 trillion. The value of trades in the APAC region fell in both Q2 (-6% QoQ [1]) and Q3 (-13% QoQ). The Americas experienced a 10% drop QoQ in Q2, but increased by 7% QoQ in Q3. In the EMEA region, the value of trades did not fluctuate much (less than 1%) over the three quarters.
- Number of equity trades in Q3 amounted to 6.1 trillion shares, up significantly by 20.7% compared to Q3 2018. Total number of shares traded in the first three quarters of 2019 amounted to 18.5 trillion. Trading volumes in the APAC region fell in both Q2 (-1% QoQ) and Q3 (-3% QoQ) but at a more moderate rate than the decline in trade values. Trade volumes in the Americas and EMEA region fell QoQ in Q2 (-4% for both regions) but increased by 2% and 7% QoQ in Q3, respectively.
- There were 544 new listings in Q3 2019, down by 6.9% compared to Q3 2018. Investment through IPOs in Q3 was valued at USD42.9 billion, a decline of 24.3% compared to the same period of 2018. Capital raised per IPO also fell. In the first three quarter of 2019, USD122.4 billion was raised through 1,706 IPOs. IPO activity was concentrated in Q2 2019, which accounted for 40% of the new listings and half of the capital raised year-to-date in 2019.
Derivatives
Trends in global derivatives contracts traded (volumes) varied by asset class:
- Single stock options [2] volumes in Q3 2019 were up by 16.9% compared to Q3 2018 but had no significant (less than 1%) QoQ change.
- Single stock futures volumes were up by 27.7% compared to Q3 2018 but down 10.8% QoQ. Large part of the increase in volumes on Q3 2018 was contributed by Borsa Istanbul, of which volumes in Q3 2019 were almost triple of that of Q3 2018.
- Stock index options volumes have experienced strong growth in 2019. Q3 2019 volumes increased 75.7% compared to the same period in 2018 and 16.2% QoQ. The National Stock Exchange of India (NSE India) recorded exceptional growth in volumes in the past 6 months. Q3 2019 volumes at NSE India increased by 135% on Q3 2018 and 24.4% QoQ.
- Stock Index futures volumes in Q3 2019 were up by 58.9% compared to Q3 2018 and 8.9% QoQ. B3 and CME Group are the main venues contributed to the growth on Q3 2018. Continuous growth throughout the first three quarters was recorded.
- ETF futures volumes were up by 42.5% compared to Q3 2018. However, trading slowed in Q3 2019 (-42.4% QoQ) compared to the strong start in the first two quarters (+73.3% QoQ in Q1 and +23.8% QoQ in Q2).
- ETF options [3] volumes were up 46% compared to Q3 2018 and 28.6% QoQ. Notably, B3 volumes in Q3 2019 were 3.3 times of that of Q3 2018.
- Currency options volume in Q3 2019 were up by 12.1% compared to Q3 2018 and 18.7% QoQ.
- Currency futures volumes in Q3 2019 had no significant change (less than 1%) compared to Q3 2018, but increased by 16.7% QoQ.
- Both interest rate options and futures recorded increase in volumes in Q3 2019 compared to Q3 2018 (+41.9% and +30.9% respectively). Such increase was due to weak trading Q3 2018 (lowest trading quarter in the latest 12-month period). Interest rate options volume fell by 8.8 QoQ while interest rate futures increased by 3.5% QoQ.
- Commodities options experienced strong growth in trades since Q2 2019. Q3 2019 volumes were up by 21.5 % compared to Q3 2018. Exceptional increase of 120.1% on Q3 2018 was recorded in the APAC region. Q3 2019 volumes was up by 2.3% QoQ after a 33.8% QoQ growth in Q2 2019.
- Commodities futures volumes were up 40.3% compared to Q3 2018, Q3 2019 volumes increased by 18.2% QoQ after a 17.4% QoQ growth in Q2 2019. Dalian Commodity Exchange, Multi Commodity Exchange of India, Shanghai Futures Exchange and the Zhengzhou Commodity Exchange are the main venues that contributed to the growth on Q3 2018.
[2] Excluding International Securities Exchange, NYSE and BSE India Ltd
[3] Excluding International Securities Exchange and NYSE