Recent IPO regional trends
Over the course of 2018, stock exchanges globally saw nearly 1,150 IPOs, for a total market capitalisation of over 1.2 trillion USD. These listings funnelled nearly 150 billion USD to the underlying economies, an important number that confirms the crucial role of stock exchanges as a funding mechanism. Yet, if one looks at global figures over the 2012-2018 period, 2018 might be seen as a negative year for IPOs, especially if compared to 2017 (in terms of number of IPOs) and 2014 (in terms of investment flows). Regionally, however, trends appear to be quite different from the global picture.
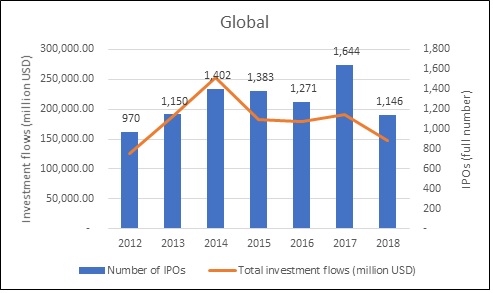
Figure 1: Global IPOs. Source: WFE IPO database
Given the recent regional trend, 2018 was overall a positive year for American primary equity markets, with 40 billion USD raised by over 220 companies going public. Compared to 2017, the number of companies going public through an IPO increased by nearly 14%. While capital flows were overall similar, the figure in 2018 was higher than in 2017 by 1.5%. American listings seem to have been catching-up since 2016, which saw a significant slowdown in the number of IPOs. However, recent figures are still low compared to pre-2016 levels.

Figure 2: IPOs in Americas. Source: WFE IPO database
The 2018 global decline was driven by the Asia-Pacific markets. These markets have experienced steady increases in both IPOs and investment flows since 2012, with investment flows peaking at 126 billion USD in 2016 and IPOs in 2017 at 1,124. In 2018, however, the number of IPOs was down nearly 40% on 2017 while investment flows fell by 13%.
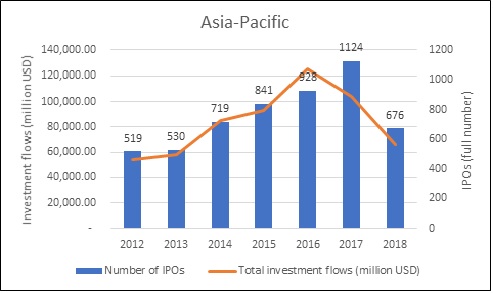
Figure 3: Asian-Pacific IPOs. Source: WFE IPO database
In EMEA, in the period under review, both IPOs and investment flows peaked in 2014 (in 2014, 361 companies raised more than 80 billion USD on EMEA’s public equity markets). Despite a resurgence in 2017, with 323 IPOs and over 70 billion USD raised, markets were again softer in 2018, with only 244 IPOs and 39 billion USD raised.
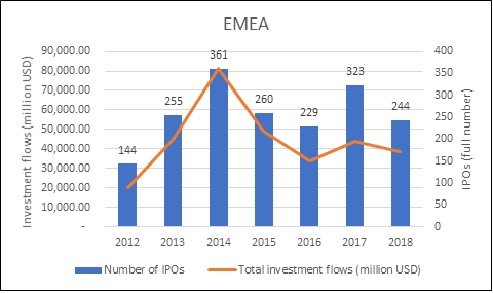
Figure 4: EMEA IPOs. Source: WFE IPO database
From these trends it can be inferred that the relative contribution of each region to the global IPO market changed over time. As can be seen from Figure 5, Asian-Pacific markets typically contributed the most in terms of number of IPOs over the 2012 to 2018 period, yet their relative share was much more balanced during 2013 and 2014, when both American and EMEA markets were at their peak.
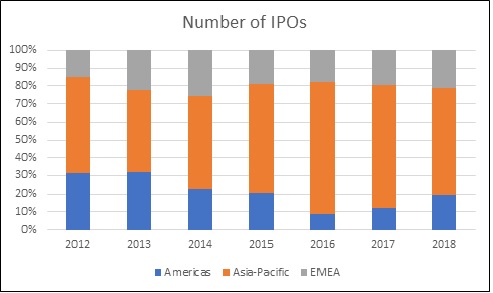
Figure 5: Relative contribution of each region to the global number of IPOs
This picture becomes even more evident when considering investment flows. Despite the conspicuous number of IPOs, the relative share of Asian-Pacific funds raised on public equity markets was sensibly smaller than the American one in 2013 (30% against 45%) and overall similar in 2014, when the three regions contributed roughly equally (Americas accounted for 34%, Asia-Pacific for 33% and EMEA for 32%). In 2016 and 2017 this trend reversed, with the Asia-Pacific region accounting for 70% and 54% of the global investment flows raised through IPOs respectively. Shares became more balanced over in 2018 as a result of the uptick in EMEA and Americas and the decline in the Asia-Pacific region described above (Americas accounted for 29%, Asia-Pacific for 44% and EMEA for 26%).
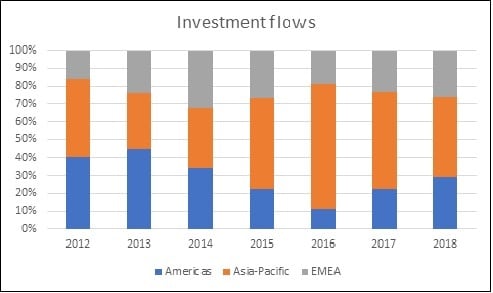
Figure 6: Relative contribution of each region to global investment flows