Share value traded EOB total and number of trades EOB
Following our Market Highlights H1 2020, in this month’s Focus article we will look at the Electronic Order Book (EOB) total value traded, number of trades, and value traded per trade, to gain more insight into the market activity.
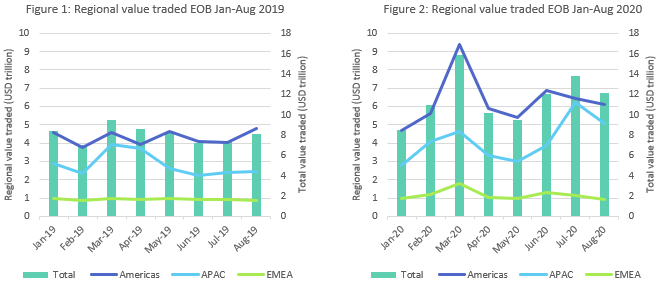
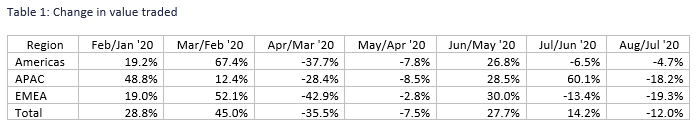
Figures 1 and 2 show that in 2020 trading activity in stocks was significantly higher compared to the same period of time in 2019. The peak in Mar 2020 in the Americas and EMEA region was a sell-off due to the spread of the coronavirus pandemic in Europe – since then, the levels of trading activity have remained higher than during the previous year. The APAC region instead peaked in Jul 2020, mostly due to Shanghai Stock Exchange, Shenzhen Stock Exchange, Taipei Stock Exchange, Taiwan Stock Exchange and Hong Kong Stock Exchange.
From table 1 we learn that the 14.2% increase in value traded in Jul 2020 compared to the previous month is entirely due to the APAC region, which grew by a significant 60.1%. This result was reversed in Aug 2020, when the global value traded registered a downtick of 12% to US$ 12.1 trillion, due to all regions declining.
Figures 3 and 4 below show how the share of value traded in stocks by region has changed in Jan-Aug 2020 as compared with the same period of time the previous year, with more value traded in APAC region in Aug 2020 than in the previous year.
When comparing Jul 2020 with Jul 2019, we find an 88.2% increase globally, with all regions experiencing a sizeable increase of 59.9% in Americas, 160.6% in APAC and 23.2% in EMEA. Aug 2020 saw a 48.9% compared with Aug 2019, with Americas increasing by 27.9%, APAC by 105.6% and EMEA by only 3.5%.
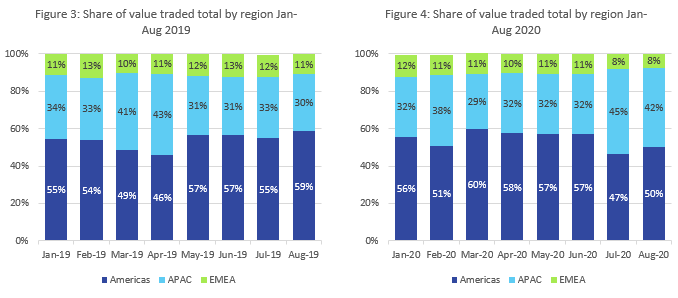
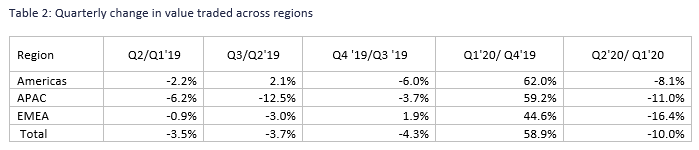
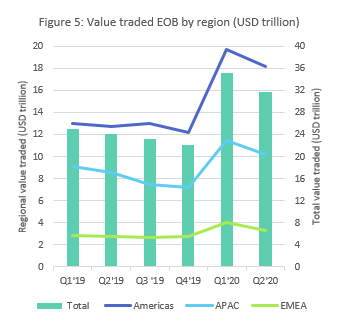
Table 2 shows regional trends at a quarterly frequency. We notice that the first quarter of 2020, as the Covid-19 pandemic was deepening, witnessed a 58.9% increase in value traded compared with the last quarter of 2019, with all regions experiencing significant upticks.
Compared with Q1 2020, Q2 2020 registered a decrease in value traded of 10% globally, with all regions declining.
Q1 2020 compared with Q1 2019 witnessed an increase in value traded of 41.3%, all regions having an uptick: Americas 52%, APAC 25.8% and EMEA 41.7%.
When comparing Q2 2020 with Q2 2019, we find a sizeable 31.8% increase globally, with all regions having significant increases: 42.8% in Americas, 19.4% in APAC and 19.5% in EMEA region.
Consistently with the results commented above, the number of trades is higher in 2020 than the same period of time in 2019 as figures 6 and 7 show.
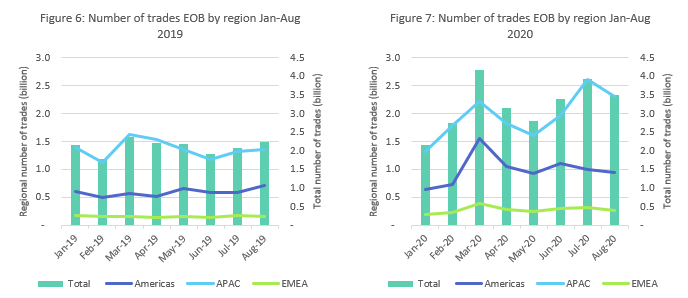
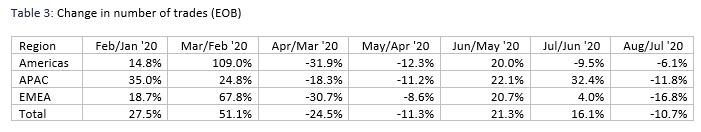
Table 3 shows that the month on month increase in number of trades in Jul 2020 of 16.1% was due to the APAC region and to a smaller extent to the EMEA region, while the Americas declined. The sizeable increase noticed in the APAC region was mostly due to the Shanghai Stock Exchange, Shenzhen Stock Exchange, Taipei Stock Exchange, Taiwan Stock Exchange and Hong Kong Stock Exchange. Aug 2020 saw a global decline in the number of trades of 10.7%. This was due to all regions having a negative trend.
When comparing Jul 2020 with Jul 2019 a significant increase of 88.6% is noticeable, with all regions having an uptrend of 69.8% in Americas, 96.9% in APAC and 89.6% in EMEA.
Aug 2020 experienced an increase of 57.5% when compared with Aug 2019, the regions witnessing more modest upticks of 32.8% in Americas, 70.2% in APAC and 59.9% in EMEA.
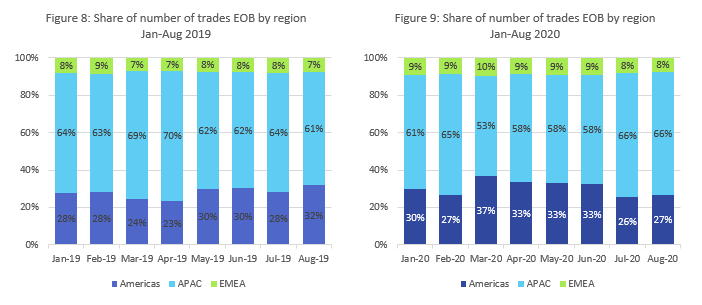
Figures 8 and 9 show the change in the share of value traded EOB by region in 2020 compared with the same period of time the previous year, with APAC increasing its share in Aug 2020 to 66% from 61% the previous August.
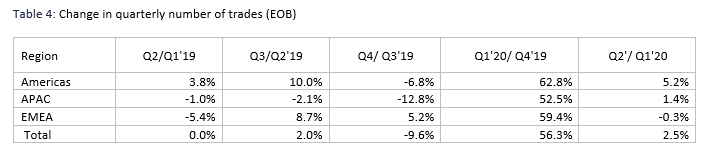
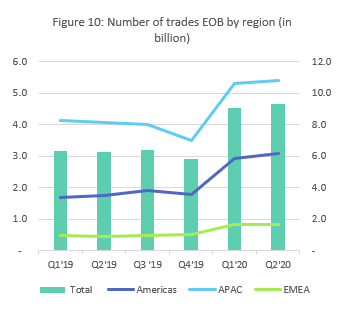
Table 4 shows the regional quarterly change. We learn that the first quarter of 2020 registered a 56.3% uptick in the number of trades compared with Q4 2019, with all regions experiencing sizeable increases.
Q2 2020 registered a smaller increase in the number of trades (2.5% globally), compared with the previous quarter, due to the growth in Americas and the more modest rise in APAC, while EMEA experienced a minor downtick.
When comparing Q1 2020 with Q1 2019, we notice a global increase of 44.1%, all regions registering an uptrend of 73.3% in Americas, 28.8% in APAC and 72.3% in EMEA.
Comparing Q2 2020 with Q2 2019 we notice an even larger increase in the number of trades, of 47.7% globally, due to all regions having an uptick of: 75.6% in the Americas, 32% in APAC and 81.6% in EMEA region.
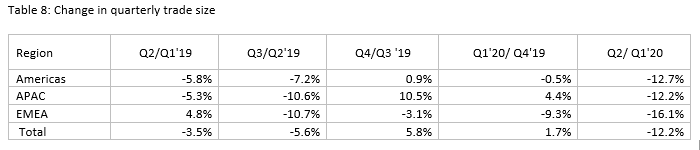
With regards to the value of trades, figures 11 and 12 show that the trades are smaller in 2020 as compared to the same month last year, with the sharpest drop in Apr 2020 of 16.1% compared to Apr 2019, and 14.6% drop compared with Mar 2020. The average value of trades seems to have declined both in Americas and EMEA after the Covid-19 crisis in Europe. Table 7 below shows the average trade size, which is considerably smaller in APAC likely because many APAC exchanges are retail-dominated.
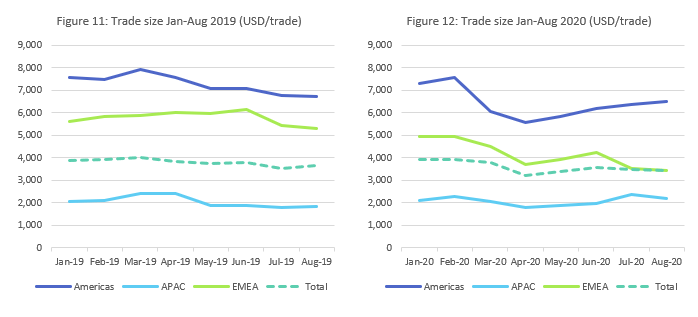
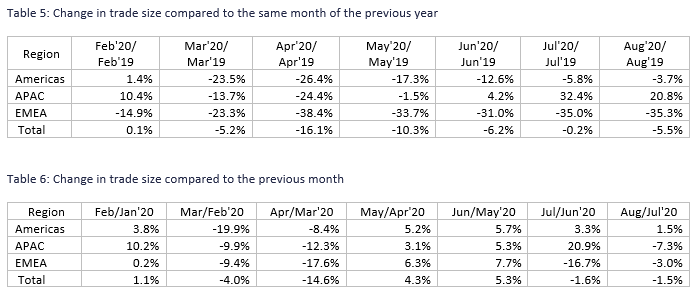
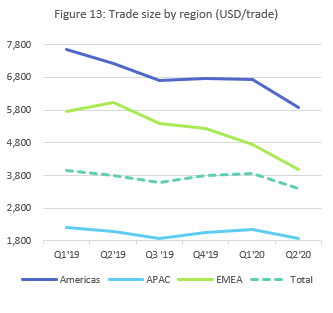
Figure 13 and table 8 show the regional quarterly change in 2019 and 2020.
The change registered in Q1 2020 compared to Q4 2019 was 1.7% globally, entirely due to the APAC region, while Americas and EMEA registered a decrease.
This trend was reversed in Q2 2020 when we noticed a downtick on the previous quarter, of 12.2%, with all regions declining.
If we compare Q1 2020 with Q1 2019, a decrease of 2.0% is noticed, all regions having a downtrend: Americas by 12.3%, APAC by 2.4% and EMEA by 17.8%.
The decrease is steeper at 10.8%, when comparing Q2 2020 with Q2 2019, with all regions decreasing: Americas by 18.6%, APAC by 9.5% and EMEA by 34.2%.
Conclusion
The Aug 2020 global figures show that less is traded in fewer and smaller trades compared to the month before.