Social bonds trends
In this article, we analyse the trends in exchange-traded social bonds in H1 2024. The data is available on the WFE Statistics Portal, while the indicators are defined in our Definitions Manual. For questions or feedback about this article, please contact the WFE Statistics Team at [email protected]
Social bonds are fixed income securities issued by corporations or governments to raise funds for new and existing projects with positive social outcomes. Of all the Environmental, Social and Governance (ESG) [1] bonds listed globally in H1 2024 38.3% are social bonds, 37.3% are green bonds and 24.4% are sustainability bonds. However, when considering new listings of ESG bonds, their value traded or the capital raised, social bonds account for the lowest share.
The number of social bonds listed in the world markets in H1 2024 reached 1,878, which represents a 26.2% rise on H1 2023, as seen in Figure 1.
Most social bonds are listed in the APAC region (87%), followed by EMEA (12.4%), while the Americas region accounts only for 0.6%.
Figure 1: Number of listed social bonds by region between May 2021 and October 2024
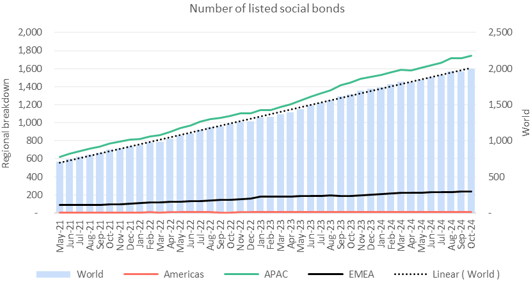
Figure 1 shows the steady increase in the number of listings globally.
With regards to social bonds new listings, H1 2024 recorded a 21.9% increase compared to H1 2023, amounting to 373, a result due mostly to EMEA region, which surged 234.9%. APAC region went down 13.3%. The Americas did not record new listings in H1 2023.
Most of the social bonds new listings took place in APAC region (61.1%), with EMEA accounting for the 38.6% and the Americas region for only 0.3%. (Figure 2).
Figure 2: Number of newly listed social bonds between May 2021 and October 2024

In Figure 2 we notice that EMEA markets surged in 2024; this result is driven mostly by the Luxembourg Stock Exchange.
Regarding the social bonds value traded, it amounted to 222.6 million USD in H1 2024, representing a 37.3% decline on H1 2023, due to 38.9% fall in the APAC region. The Americas and EMEA regions did not trade social bonds in H1 2023.
It is worth noting that the traded value is dominated by the APAC region, which has 97.5% of the value traded, while the Americas accounts for 2.2% and EMEA region for only 0.2%. Value traded is a very volatile indicator, with months of high value traded followed by months of almost zero value traded (Figure 3).
Figure 3: Social bonds value traded by region between May 2021 and October 2024

With regards to capital raised, 65.5% of the capital was generated on markets in the EMEA region, 21.4% in APAC and the rest of 13.1% in the Americas region (as shown in Figure 4).
The capital raised increased 92.3%, amounting to 91.32 billion USD, due to EMEA and the Americas regions, which went up 332.4% and 56.5%, respectively, while APAC region declined 24.9%.
Figure 4: Capital raised with social bonds between May 2021 and October 2024

The surge in EMEA markets in 2024 is due mostly to the Luxembourg Stock Exchange.
In conclusion, the positive trends we observe in each of these four metrics, indicate an increase in capital raised for investment in social projects, notably in 2024; and a growing interest in funding social projects through exchange-traded bonds.
For more WFE statistical reports, please click here.
For our research papers on emerging markets, SMEs, sustainability, technology etc, please click here.
For our regulatory affairs papers on clearing, cross-border, market integrity, market structure, risk or technology, please click here.
[1] The WFE 10th Annual Sustainability Survey is available on our website https://www.world-exchanges.org/our-work/articles/wfe-10th-annual-sustainability-survey