Stock index options and futures
In this article we analyse the trends in stock index derivatives in 2021 compared to 2020. Stock index derivatives include both options and futures contracts traded.
The data is taken from the WFE Statistics Portal. The definition of our indicators can be found in WFE Definitions Manual.
The number of stock index derivatives contracts traded in Q3 2021 was 6.59 billion, which was a 28.9% increase on Q2 2021 and a 66.1% increase on Q3 2020. Futures accounted for 31% of all stock index derivatives contracts traded, while options for 69%.
Year-to-date stock index derivatives volumes were 16.72 billion, made up of 5.81 billion futures and 10.91 billion options. Most of the futures contracts in 2021 were traded in the Americas (4.37 billion), followed by APAC (841 million) and EMEA (596 million), while most of the options contracts in 2021 were traded in APAC (10 billion), followed by the Americas (540 million) and EMEA (319 million).
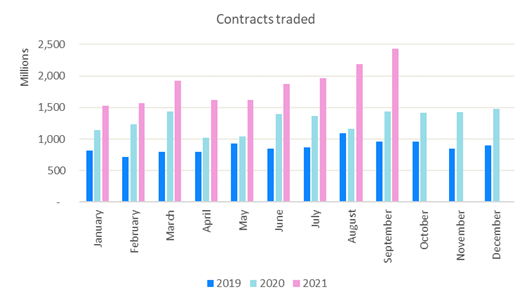
Figure 1: Number of stock index options and futures contracts traded between Jan 2019 – Sept 2021
Quarter-on-quarter, in Q3 2021, the number of options contracts traded increased 38.9%, while futures rose 11%. Year-on-year, in Q3 2021 the increase was more pronounced, options volumes rose 95.7%, while futures went up 24.2%.
The increase in number of futures contracts traded in Q3 2021 compared to the previous quarter was due to the rise across the Americas (19.6%), while APAC and EMEA declined 17.4% and 4.1% respectively. Exchanges with an excellent performance in Q3 2021 were: B3 - Brasil Bolsa Balcão (24.4%) and CME Group (2.5%).
The volumes of options in Q3 2021 relative to the previous quarter increased due to the Americas (15.3%) and APAC (41.6%), while EMEA decreased (0.8%). Exchanges which did very well were: Cboe Global Markets (8.9%), CME Group (23.8%), B3 - Brasil Bolsa Balcão (43.9%), Nasdaq-US (33.7%), National Stock Exchange of India (44.7%), Korea Exchange (21.2%), China Financial Futures Exchange (25.2%), Hong Kong Exchanges and Clearing (47.2%) and Japan Exchange Group (5.2%).
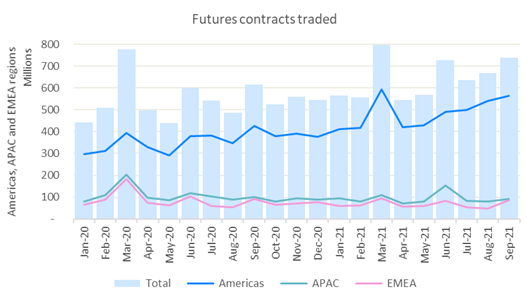
In Q3 2021, futures contracts were traded mostly in the Americas (79%), followed by APAC (12%) and EMEA (9%).
Year-on-year, in Q3 2021 futures volumes rose in the Americas by a significant 39.2% (due mostly to B3 - Brasil Bolsa Balcão and Cboe Global Markets), while APAC and EMEA declined 13.2% and 7.9%, respectively.
Figure 2: Number of stock index futures contracts traded between Jan 2020 – Sept 2021
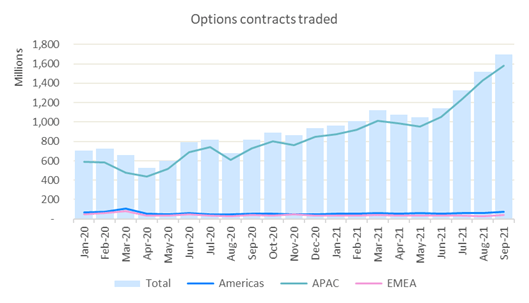
APAC has the largest share of option contracts traded (93%), while the Americas and EMEA account for 4% and 2%, respectively.
Year on year, in Q3 2021 the increase in options volumes was due to all regions: the Americas 32.5%, APAC 104.6% and EMEA 2.5%. Exchanges with a notable performance were: National Stock Exchange of India (85.7%), Korea Exchange (2.9%), Cboe Global Markets (23.6%), Taiwan Futures Exchange (2.7%), CME Group (30.5%), India International Exchange (31.5%), B3 - Brasil Bolsa Balcão (52.9%), China Financial Futures Exchange (61%), Japan Exchange Group (1.4%) and Nasdaq – US (176.3%).
Figure 3: Number of stock index options contracts traded between Jan 2020 – Sept 2021
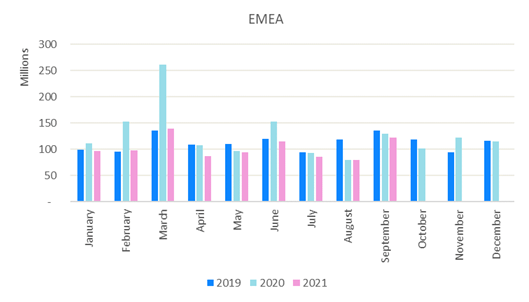
The number of stock index options and futures traded in each region is illustrated in Figures 4-6.
Figure 4: Number of stock index options and futures contracts traded in the Americas between Jan 2019 – Sept 2021
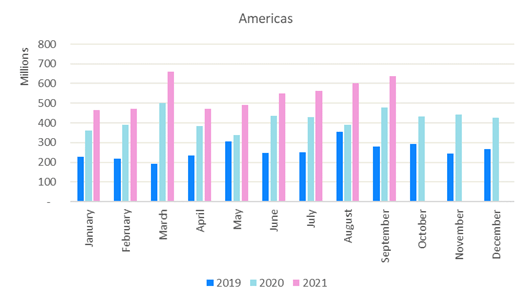
Figure 5: Number of stock index options and futures contracts traded in APAC between Jan 2019 – Sept 2021
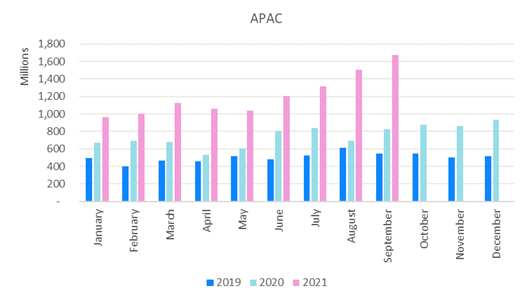
Figure 6: Number of stock index options and futures contracts traded in EMEA between Jan 2019 – Sept 2021