Value of share trading EOB
In this article, we analyse the trends in value of share trading EOB (Electronic Order Book) observed in the last year. The data is available on the WFE Statistics Portal, while the indicators are defined in our Definitions Manual. For questions or feedback about this article, please contact the WFE Statistics Team at [email protected].
The value of share trading EOB in Q1 2023 was 32.78 trillion USD, which represented a 5.3% increase on Q4 2022 and 26.8% decline on Q1 2022 (Figure 1).
Value of share trading EOB domestic represents 97% of the value traded EOB, while the value of share trading EOB foreign accounts for the rest of 3%.
As Figure 1 shows, most of the value is traded in the Americas region (54%), followed by APAC (36%), the rest of 10% being traded in the EMEA region.
57% of the value traded EOB domestic takes place on APAC markets, 34% on markets in the Americas region and the rest of 9% on EMEA markets (Figure 2).
Figure 1: Value traded EOB total between January 2021 - April 2023
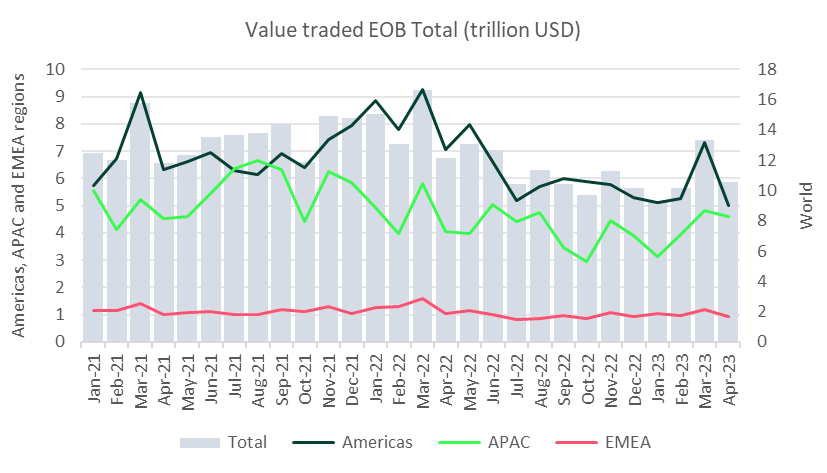
Note: The sum of the value traded EOB domestic and the value traded EOB foreign equals less than the value traded EOB total because some exchanges could not provide the breakdown and submitted only the total amount.
Figure 2: Value traded EOB domestic between January 2021 - April 2023
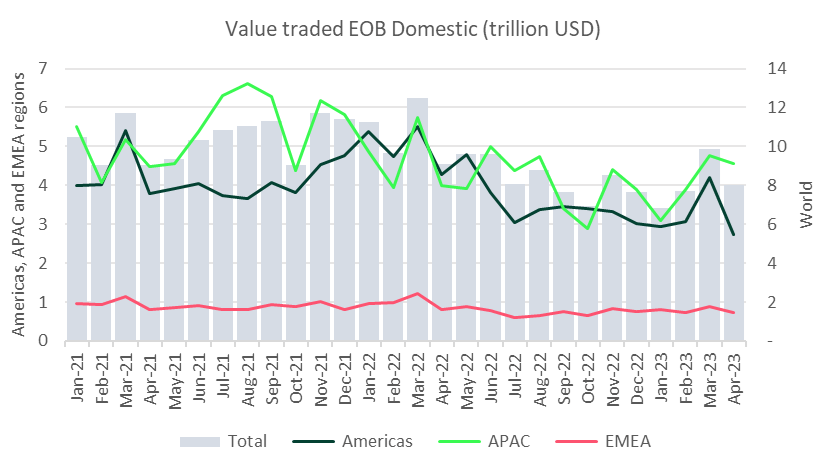
Figure 3: Value traded EOB foreign between January 2021 - April 2023
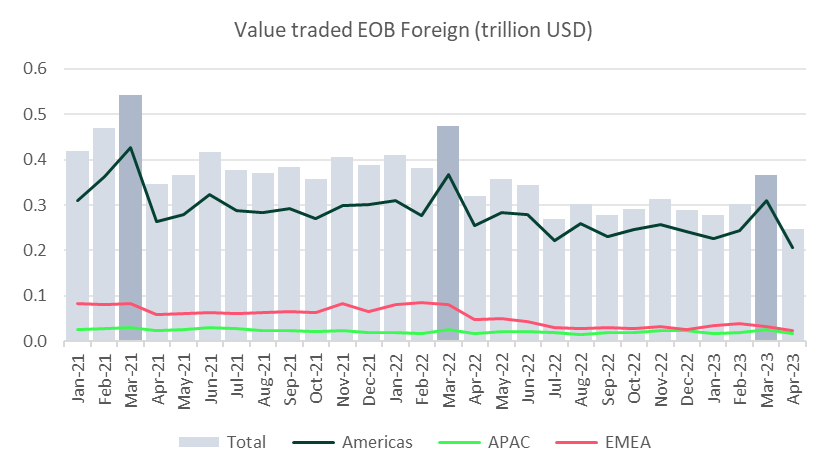
In the last three years we notice that the value traded EOB foreign peaks in March, but the peaks are getting lower each year, followed by a very low April.
Year-to-date[1], the value of share trading EOB amounted to 43.13 trillion USD, of which 22.74 trillion USD was traded in the Americas region, 16.48 in APAC and 4.12 in EMEA region.
Quarter-on-quarter, in Q1 2023 value of share trading EOB went up 5.3%, due to all regions increasing: the Americas 4.3%, APAC 5.3% and EMEA 11.7%.
In H2 2022 the value of share trading EOB total fell 23.5% (reaching only 43.31 trillion USD), when compared to H1 2022, due to all regions declining: the Americas (-28.9%), APAC (13.8%) and EMEA region (25.1%). When compared to H2 2021 the decrease is similar (-24.2%), observed across all regions: the Americas (-17.6%), APAC (-33.2%) and EMEA region (-16.5%).
In 2022 the value of share traded EOB declined 9.6% compared to 2021, amounting only to 145.93 trillion USD, with all regions having a negative trend: the Americas (-1.4%), APAC (-20.9%) and EMEA region (-4.8%).
Exchanges that recorded double digit increases in value traded EOB in Q1 2023 compared to Q4 2022 were: MIAX Exchange Group (28.3%), Korea Exchange (39.9%), The Stock Exchange of Thailand (20.4%), Cboe Europe (21.6%), Deutsche Boerse AG (26%), Nasdaq Nordic and Baltics (13.6%) and SIX Swiss Exchange (21.5%).
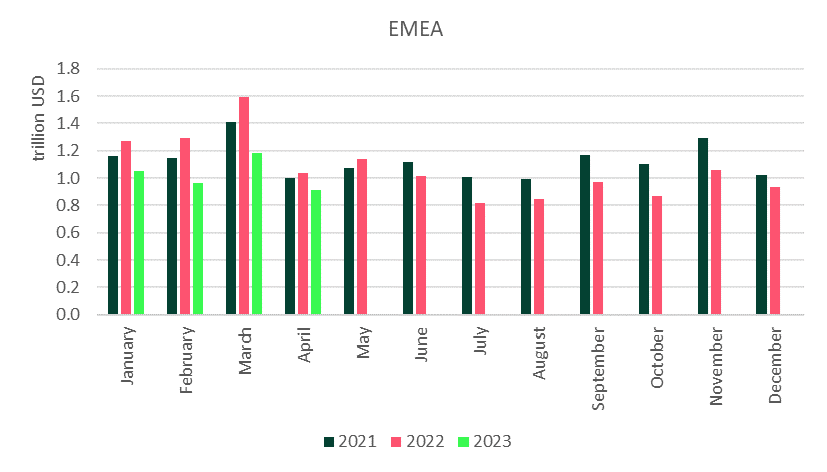
The value of share trading EOB in each region is illustrated in Figures 4-6.
Figure 4: Value of share trading EOB total in the Americas region between January 2021 - April 2023
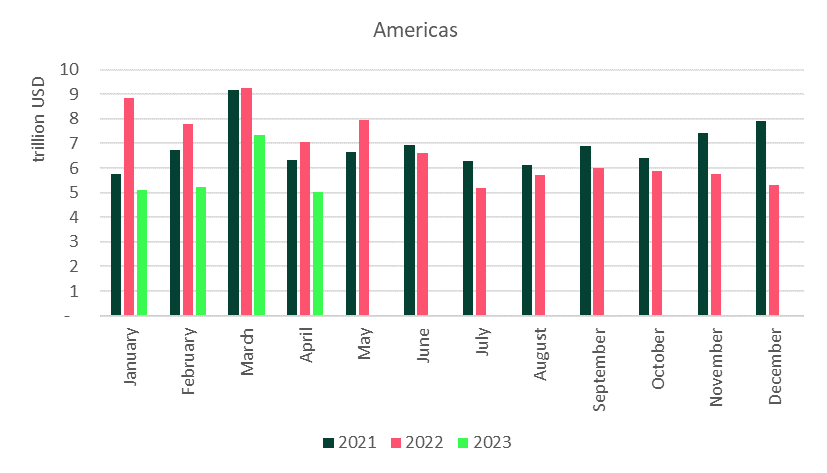
Figure 5: Value of share trading EOB total in APAC region between January 2021 - April 2023
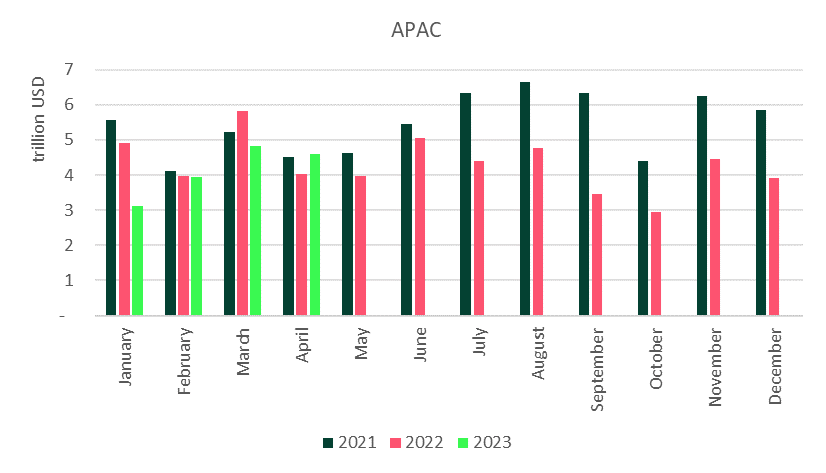
Figure 6: Value of share trading EOB total in EMEA region between January 2021 - April 2023
[1] January to April 2023