Drivers of Exchange Sustainability Development: Evidence From a Decade of Surveys
This paper provides an analysis of the drivers influencing exchanges’ focus on Environmental, Social, and Governance (ESG) efforts, along with the motivations behind their sustainability initiatives, and the development of ESG-related financial products. By contrasting data from ten years of the World Federation of Exchanges (WFE)’s annual Sustainability Surveys against various environmental, eco nomic, and cultural factors, we test which of these factors correlate with ESG initiatives across 66 security exchanges from 54 jurisdictions. The findings show that ESG advancements are shaped by a complex interplay of the jurisdiction’s governance quality, environmental conditions, economic infrastructure, and cultural dimensions, providing important guidance for tailoring ESG strategies to the unique contexts of each jurisdiction.
This paper by Kaitao Lin1 and Ying Liu2 was published in July 2025
Acknowledgments: The authors would like to thank Pedro Gurrola-Perez and Paula Redondo Pereira for their useful comments. Any errors are ours.
Introduction
In recent decades, Environmental, Social, and Governance (ESG) has gained significant prominence in the global financial landscape, influencing decision-making processes across various sectors. Numerous studies have examined ESG practices among corporations (Bancel, Glavas, and Karolyi, 2023; Cao, Liang, and Zhan, 2019; Cao et al., 2023), institutional investors (Krueger, Sautner, and Starks, 2020; Edmans, Gosling, and Jenter, 2024), retail investors (Giglio et al., 2023), and security regulators (Karpoff et al., 2022), yet little attention has been given to exchanges. As key players in the capital markets, exchanges have increasingly integrated ESG principles, shaping both their internal policies and those of their listed companies. Recent studies show that stock exchanges have evolved into active promoters of corporate sustainability through ESG reporting, transparency initiatives, and sustainable financial innovations3. While existing research has largely focused on exchanges’ role in promoting ESG disclosure practices, broader questions about the underlying drivers of exchanges’ sustainability efforts across different contexts remain underexplored.
This paper aims to understand whether there are economic, institutional, social, and cultural fac tors driving the levels and the types of engagement with ESG that exchanges across jurisdictions have demonstrated in the last decade. The results provide insights into the interplay between exchanges’ ESG strategies and their jurisdiction’s unique economic, social, and institutional context. These insights provide valuable guidance for policymakers, regulators, and exchanges seeking to promote ESG development. Adapting ESG strategies to the specific environmental, economic, and cultural contexts of each jurisdiction would be crucial for fostering the growth of sustainable and responsible financial practices.
Our analysis focuses on the key aspects of ESG engagement by exchanges: the percentage of their total ESG effort that exchanges allocate to each individual ESG component (E, S, or G); the under lying motivations driving their adoption of ESG initiatives; the offering of ESG-related products; and the inclusion of the exchange’s own stock in an ESG index. We obtain these data from a decade of Sustainability Surveys (2015–2024) conducted by the World Federation of Exchanges (WFE) among its members and affiliates. Using panel regression models with multiple fixed effects, the study examines how country-level characteristics—such as environmental performance, institutional quality, and cultural dimensions—affect exchanges’ ESG engagement and initiatives.
First, we investigate the factors influencing exchanges’ focus on environmental, social, and governance efforts. For environmental efforts (e.g., reducing energy and using renewable energy sources, encouraging recycling, and reducing the amount of waste destined for landfill), the findings suggest that exchanges in regions with higher literacy rates, on average, place significantly less emphasis on environmental initiatives, potentially because educated populations already expect strong environmental standards. Long-term orientation culture, a culture in which individuals prioritise a future-oriented perspective over a short-term point of view, has a significant and positive influence, indicating that future-oriented societies prioritise environmental sustainability. For social efforts, power distance (the extent to which the less powerful members of society accept an unequal distribution of power) and masculinity culture (traditionally masculine values are prioritised over feminine values) negatively affects social concerns, while uncertainty avoidance (low tolerance to uncertainty) positively influences a focus on social issues, highlighting a desire for social protections in risk-averse societies. Regarding governance efforts, literacy rate positively impacts governance focus, in contrast with environmental efforts, reflecting a higher public demand for well-designed policies and structures in more educated regions. Interestingly and intuitively, the results also show that governance effort is negatively associated with the jurisdiction’s perceived corruption level, signaling the effectiveness of governance in combating corruption.
Second, we examine the diverse motivations driving exchanges’ ESG advancements, such as sustain ability concerns, regulatory requirements, reputation, and competition. In a recent American Finance Association (AFA) presidential address, Starks (2023) highlights the role of countries’ characteristics in the motivation for ESG investing. In this paper, we find that the total market capitalisation of the exchange’s listed equity is negatively associated with reputational motivations, indicating that larger markets may already have established reputations, reducing additional pressure for ESG engagement.
Moreover, cultural dimensions play a prominent role, with long-term orientation and indulgence (a measure of the extent to which people express their desires and impulses in a society) positively affecting motivations across different categories, indicating that exchanges in societies valuing future orientation and personal enjoyment and self-expression are more likely to pursue ESG initiatives. Conversely, uncertainty avoidance and power distance negatively impact competition motivations, suggesting that societies with a low tolerance for uncertainty may view ESG advancements as risky and unpredictable, leading to hesitance in adopting innovative or competitive ESG strategies. Similarly, in more authoritarian societies characterised by high power distance, traditional market structures and hierarchical decision-making processes may favour stability and conformity over the adoption of progressive ESG initiatives.
Lastly, we study the factors influencing the development of ESG-related financial products across exchanges. Our results show that jurisdictions with larger forest areas are significantly more likely to develop sustainability-related products, such as ESG ETFs, suggesting a strong connection between natural resources and environmental finance. Also, the exchange’s market capitalisation positively influences the development of various ESG offerings, indicating that more developed financial markets are better equipped to support sustainable investment initiatives. Additionally, cultural dimensions such as individualism (a societal tendency where people only look after themselves and their immediate family) and long-term orientation are key drivers. Societies that emphasise personal responsibility and future planning are more engaged in creating sustainability-related financial products. Conversely, high uncertainty avoidance discourages ESG-related innovation, particularly for ESG ratings and indices, indicating that risk-averse societies may be less likely to invest in certain sustainability efforts. We also find that publicly-list exchanges’ stock in more sustainable economies are more like to be included in a designated ESG index.
Overall, the findings from this study highlight the intricate interplay of environmental, economic, and cultural factors in shaping exchanges’ focus on ESG efforts. The quality of governance in a country, its environmental performance, the characteristics of its population, including cultural aspects, significantly influence the adoption of ESG initiatives and the development of sustainability-related financial products.
Related literature
Our paper relates to the extensive literature studying the motivation behind firms’ sustainability practices,4 including (1) altruism and social concerns (e.g., Benabou and Tirole, 2006; Brown, Helland, and Smith, 2006; Baron, 2010; Benabou and Tirole, 2010); (2) regulatory pressure (e.g., Innes and Sam, 2008; Lanoie et al., 2011); (3) reputation and social pressure (e.g., Brown, Helland, and Smith, 2006; Fisman, Heal, and Nair, 2007; Baron, Harjoto, and Jo, 2011; Cahan et al., 2015); and (4) business competition (e.g., Bagnoli and Watts, 2003; Shleifer, 2004; Fisman, Heal, and Nair, 2007; Fernandez Kranz and Santalo, 2010). Our paper delves into the role of different jurisdictions’ characteristics in driving these sustainability motivations.
Related papers have also analysed the impact of different countries’ economic condition and cultural norms on sustainable investment. Indeed, Cai, Pan, and Statman (2016) find that variation in sustainability performance across countries is associated more strongly with country factors than with firm characteristics. In a study of cross-country variations in environmental performance, Esty and Porter (2005) demonstrate that these differences are linked to the quality of a country’s environmental regulatory regime and economic factors. Hoepner, Majoch, and Zhou (2021) show that home-country cultural norms affect institutions’ decision to sign on to the United Nations’ Principles of Responsible Investment (PRI).
Data
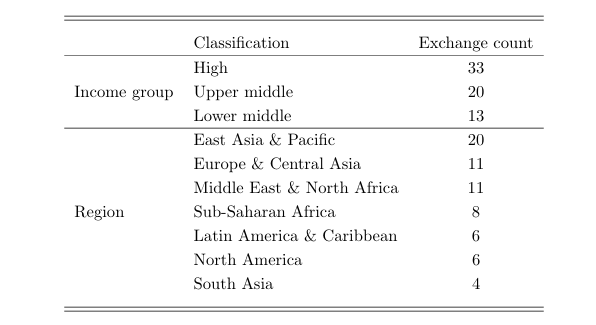
Our data sample comprises two categories: exchange-level data and jurisdiction-level data. For the exchange-level data, we utilise the annual sustainability survey conducted by the World Federation of Exchanges, collected from its members and affiliates between 2015 and 2024, covering data for the years 2014 to 2023.5 The sustainability survey was designed to capture the progress and achievements of the exchange industry in its engagement with ESG issues as well as the challenges it faces in achieving its ESG goals. The questionnaire asks exchanges about their engagement in diverse sustainability initiatives, transparency and reporting, and sustainability products. The questions are updated annually to reflect the evolving sustainability landscape.6 The number of responses received each year also fluctuates. To enhance the robustness of the analysis, we require that, to be included in the analysis, each exchange member participates in the survey at least four times over the past ten years. Ultimately, we obtained data from 66 exchanges, representing 54 jurisdictions. Table A1 in the Appendix lists the exchanges covered in the sample. It also reports the income group and region for each jurisdiction, based on the World Bank country classification.7 The last column of the table documents the number of times each exchange participated in the annual sustainability survey over the past ten years. Table 1 provides an overview of the distribution of exchanges across income groups and regions, following the World Bank’s classification criteria. When considering the income group distribution, it is shown that 50% of the exchanges in our sample are concentrated in high-income economies, with a total of 33 exchanges. The regional distribution highlights that the East Asia & Pacific region contains the largest number of exchanges in our sample, with 20 in total (30%). Latin America & the Caribbean, North America, and South Asia are the regions with the fewest exchanges in our sample.
2.1 Dependent variables
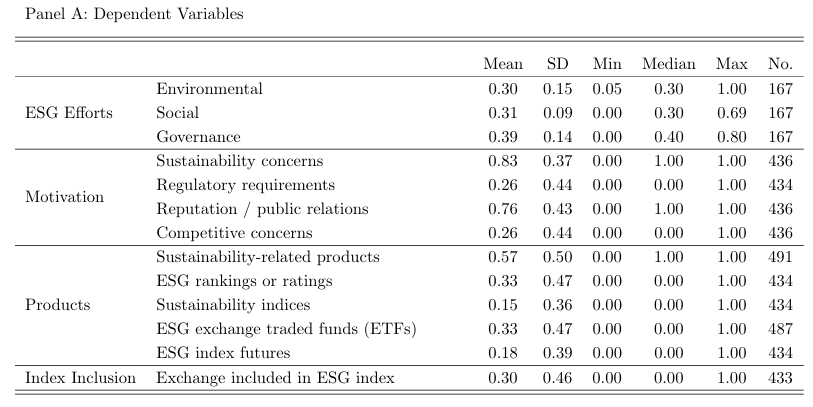
The survey collected information about how the exchange distributes its sustainability efforts between the between E, S, and G; the motivations behind exchanges implementing ESG practices; and the sustainability products introduced by the exchanges. The dependent variables in our analysis are the responses provided by exchanges in the annual Sustainability Survey. We selected key variables with the highest response rates as our dependent variables for analysis. Panel A of Table 2 reports the summary statistics of the dependent variables. For the first section, ESG Efforts, the survey requires the respondents to provide the percentage of their total ESG efforts that are focused on Environmental (E), Social (S) and Governance (G), respectively.8
Table 1. Number of exchanges across income group and regions
This table presents the number of exchanges for each income group and each region, respectively. Classifications of income groups and regions follow the World Bank criteria.
Each measure ranges from 0 and 1, with 1 representing 100% allocation. Panel A of Table 2 reveals that among the three attributes, exchanges allocate the most effort to Governance, with an average of 39%. In comparison, the average allocation for Environmental efforts is 30%, while Social efforts are slightly higher at 31%.
For the second section, Motivation, the survey asks the exchanges to select the factors (multiple choices allowed) that motivate their involvement in sustainability, including (1) Sustainability concerns, (2) Regulatory requirements, (3) Reputation / public relations, and (4) Competitive concerns. We represent these binary choices with a one (when the factor is selected) or a zero (when the factor is not selected). Panel A of table 2 shows that Sustainability concerns are the most significant motivator, with a mean of 0.83, indicating that 83% of the respondents recognised this factor as a driving force. Reputation and public relations appear to be the second most important factors, with 76% of exchanges selecting it as a motivator. In contrast, Regulatory requirement and Competitive concerns are less significant motivators, both with a mean of 0.26. In other words, only a small portion of respondents perceive regulatory mandates or competitive pressures as significant motivators.
Respondents to the surveys also had to indicate whether they were offering sustainability-related products (e.g., green bonds, social bonds), sustainability rankings or ratings, ESG ETFs, sustainable indices, or ESG index futures. Depending on whether the answer was positive or negative we assign one or zero. On average, 57% of exchanges offer sustainability-related products, while approximately one third (33%) provide ESG rankings or ratings, as well as ESG exchange-traded funds (ETFs). Around 18% of exchanges offer ESG index futures and 15% offer sustainability indices.
Finally, respondents also had to indicate whether their exchange has been included in sustainability or ESG indices. Being a component of a sustainability index reflects a further level of scrutiny and is often seen as validation of the exchange’s ESG engagement. On average, 30% of the exchanges are included in an ESG index.
2.2 Independent variables
To understand the drivers behind ESG advancements across different exchanges, we collected ten years of data at the jurisdictional level, integrating various environmental, social, economic, and cultural dimensions from multiple established data sources.
Table 2. Summary Statistics
This table presents the summary statistics for the dependent and independent variables used in the analysis. Panel A provides descriptive statistics for the dependent variables, including environmental, social, and governance efforts, motivations for ESG adoption (sustainability concerns, regulatory requirements, reputation/public relations, and competitive concerns),and the availability of ESG-related financial products (sustainability-related products, ESG rankings/ratings, sustainability indices, ESG exchange traded funds (ETFs),ESG index futures, and exchange inclusion in ESG indices). Panel B reports summary statistics for the independent variables, such as the Environmental Performance Index (EPI), forest area, average temperature,CO2 emissions, GDP growth, market capitalisation, population size, literacy rate, and cultural dimensions (power distance, individualism, masculinity, uncertainty avoidance, long-term orientation, and indulgence). The table provides mean, standard deviation, minimum, median, and maximum values, along with the number of observations for each variable.
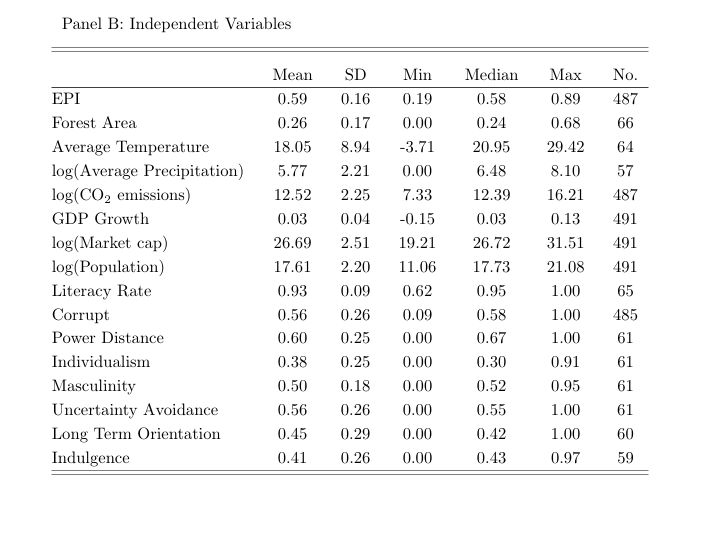
These four dimensions align with global sustainability frameworks, such as the United Nations Sustainable Development Goals (SDGs), which highlight their critical role in achieving sustainable development. Panel B of Table 2 provides a summary of the variables. To evaluate each jurisdiction’s environmental performance over the past decade, we employ the Environmental Performance Index (EPI), a measure developed by the Yale Center for Environmental Law & Policy.9 The EPI ranks countries based on their proximity to specific environmental policy targets, providing a snapshot of sustainability performance at a national level (Hsu et al., 2016; Block et al., 2024). It also serves as a reliable benchmark to evaluate and compare the environmental dimension of ESG performance across countries (Gratcheva, Emery, and Wang, 2020). For our study, we extract the EPI scores from the past ten years to assess trends in environmental performance. Since the EPI scores are released once every two years, with data available only for even-numbered years, we fill the values for the odd-numbered years by carrying forward the scores from the previous year. This approach ensures that we have a consistent annual dataset to analyse environmental performance across jurisdictions while accounting for the EPI’s release schedule. We scale the EPI ranks by dividing it by 100, so that the value ranges from 0 to 1. A higher EPI value indicates better environmental performance. The average EPI score in our dataset is 0.59, with a standard deviation of 0.16, ranging from a minimum of 0.19 to a maximum of 0.89.
For the analysis of geographical characteristics, we gather data on CO2 emissions (metric tons per capita), forest coverage (proportion of land area), climate variables (e.g., average temperature (°C) and precipitation (mm per year)), and socio-economic factors (e.g., total population, adult literacy rates, and GDP growth). These data are sourced from the World Bank Open Data database.10 Such variables are crucial as environmental outcomes are not only shaped by policy but also by underlying geographical and socio-economic contexts. For example, the mean forest area in our sample is 26%, with a wide range from 0% to 68%, suggesting that some jurisdictions have extensive forest coverage, which can serve as significant carbon sinks, influencing their overall sustainability performance (Pan et al., 2011).
The average temperature of 18.05°C across jurisdictions (with a standard deviation of 8.94°C) indicates varying climates, which can influence policy needs and environmental challenges. The precipitation (log transformed, with mean 5.77, SD 2.21) and CO2 emissions (log-transformed, with mean 12.52, SD 2.25) further highlight the diversity in natural and human-made environmental pressures faced by different regions.
In addition, from the World Federation of Exchanges Statistics Portal, we collect data on the total market capitalisation of equity markets to assess the financial market dimension of each jurisdiction’s ESG infrastructure.11 To capture institutional quality, we included data from Transparency International’s Corruption Perceptions Index, which provides a measure of perceived public sector corruption.12 A corrupt environment could reduce governance effectiveness and negatively impacting ESG performance.
For instance, Zhang and chow So (2024) found that corruption exposure negatively affects all three dimensions of ESG performance in multinational firms. To quantify corruption, we scale the index by dividing it by 100 so that the value ranges from 0 to 1 and then take 1 minus the corruption index as our measure of corruption level (Corrupt = 1 − CorruptIndex/100). In other words, a corruption value of 1 indicates a highly corrupt public sector, and a value of 0 reflects a very clean public sector.
Lastly, to account for cultural influences on ESG performance, we include Hofstede’s Cultural Dimensions in our dataset, using values collected from the Culture Factor Group.13 Hofstede’s framework has been widely applied in cross-cultural studies to understand how cultural values shape business practices and policy preferences (Hofstede, 2011). The six dimensions — Power Distance, Individualism, Masculinity, Uncertainty Avoidance, Long-Term Orientation, and Indulgence — capture how societal norms and attitudes may affect ESG outcomes. We obtain the latest available values of such scores, countries’ scores on the Hofstede dimensions relative to the scores of other countries do not change very much over time (Beugelsdijk, Maseland, and Van Hoorn, 2015).14
Regarding the individual dimensions, Power Distance measures the extent to which the less powerful members of society accept an unequal distribution of power. In societies with high power distance, individuals are more likely to accept hierarchical structures and unequal power distribution as normal. The mean Power Distance score of 0.60 suggests that, on average, many societies in our sample accept hierarchical structures, which may influence how top-down environmental policies are implemented. Individualism refers to a societal tendency where people only look after themselves and their immediate family. Masculinity measures the degree to which traditionally masculine values are prioritised over feminine values in a society. Uncertainty Avoidance measures the extent to which people feel threatened by uncertainty and ambiguity and try to avoid such situation. In a society with high uncertainty avoidance, individuals typically seek stability and clarity, prioritizing predictability over risk. Long Term Orientation reflects the degree to which individuals prioritise future-oriented or pragmatic perspective rather than a normative or short-term point of view. Indulgence measures the extent to which people express their desires and impulses in a society. In cultures with high indulgence, personal enjoyment and self-expression are highly valued. These six cultural dimensions are scaled by dividing their values by 100, ensuring that they range from 0 to 1.
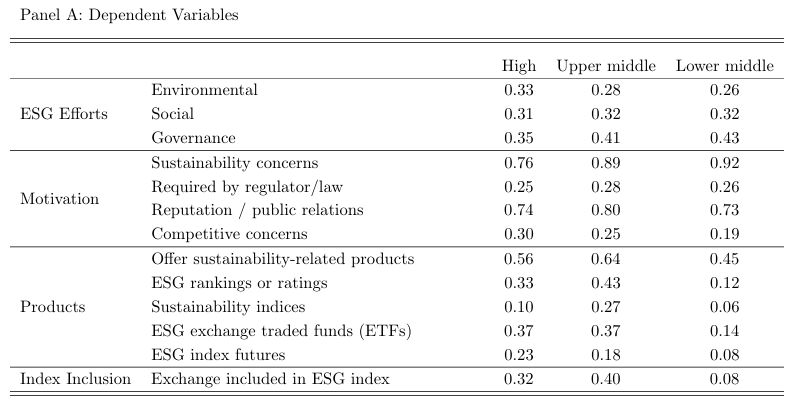
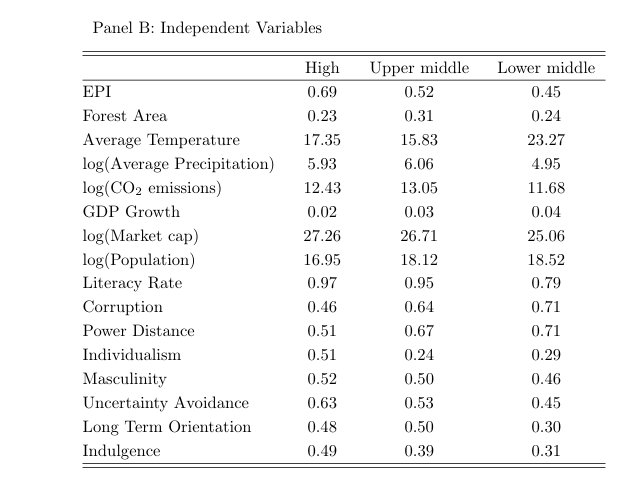
Table 3 provides summary statistics by income group, showing both dependent variables (Panel A) and independent variables (Panel B) across high, upper-middle, and lower-middle income economies. In terms of ESG efforts, the summary statistics show relatively similar levels of focus across the three income groups. In Panel A, governance appears to be a slightly higher priority, particularly in upper-middle and lower-middle income economies (0.41 and 0.43 respectively), compared to high-income economies (0.35).
Environmental and social efforts are relatively balanced across the three groups, with slight variation in environmental efforts. Looking at the motivations for ESG advancements, sustainability concerns are notably stronger in upper-middle (0.89) and lower-middle income economies (0.92) compared to high income economies (0.76). This suggests that environmental sustainability is a more pressing issue in less wealthy jurisdictions, likely due to greater vulnerability to environmental risks. Competitive concerns, however, are higher in high-income economies (0.30), reflecting the importance of maintaining market competitiveness in more developed markets. Reputation/public relations motivations are relatively balanced across the groups, with a slight peak in upper-middle income economies (0.80). When it comes to ESG-related products, upper-middle-income economies lead in offering sustainability-related products (0.64), as well as rankings/ratings (0.43) and sustainability indices (0.27). In contrast, lower middle-income economies lag behind in the development of ESG products, especially in terms of ESG exchange-traded funds (ETFs) (0.14) and index futures (0.08). They are also less frequently included in ESG indices(0.08). This observation goes in line with Esty and Porter (2005), who show that national environmental performance varies across income levels.
As shown in Panel B, high-income economies have higher Environmental Performance Index (EPI) scores (0.69) compared to upper-middle (0.52) and lower-middle-income economies (0.45). The average temperature is notably higher in lower-middle-income economies (23.27oC), which could contribute to increased environmental vulnerabilities and the strong sustainability concerns reflected in Panel A.
CO2 emissions are also relatively lower in lower-middle-income economies (11.68) compared to their upper- and high-income counterparts, which may reflect differences in industrial activity and energy consumption. Economic factors such as GDP growth and market capitalisation show disparities, with lower-middle-income countries having the highest GDP growth but significantly lower market capitalisation. The differences in literacy rates are particularly striking, with high-income countries reporting near-universal literacy (0.97) compared to lower-middle-income countries (0.79), reflecting broader education gaps. Cultural dimensions, such as power distance, individualism, and uncertainty avoidance, also differ significantly. Lower-middle-income countries have the highest power distance (0.71) and lowest individualism (0.29), suggesting more hierarchical and collectivist societies.
Table 3. Summary Statistics by income group
This table presents summary statistics for both dependent and independent variables across three income groups: high-income, upper-middle-income, and lower-middle-income economies. Panel A reports the mean values of ESG efforts, motivations for ESG advancements, and the availability of ESG-related financial products. Panel B provides summary statistics for the independent variables, including environmental metrics, climate factors, economic indicators, and cultural dimensions
3 Empirical results
With the variables described above, we estimate the following panel regression model to analyse the drivers of ESG advancements across exchanges:

where Qi,t represents the dependent variable for exchange i in year t, capturing its response to a specific survey question related to ESG practices or motivations. The vector Xi,t consists of the jurisdiction-year level covariates described in Section 2, including environmental, social, economic, and cultural factors. We incorporate several fixed effects to control for unobserved heterogeneity, including year fixed effects (αt), region fixed effects (αregion), and income group fixed effects (αincome). To address potential issues of serial correlation and heteroscedasticity, we cluster the standard errors by year, which adjusts for possible correlations in the residuals across observations within the same time period.
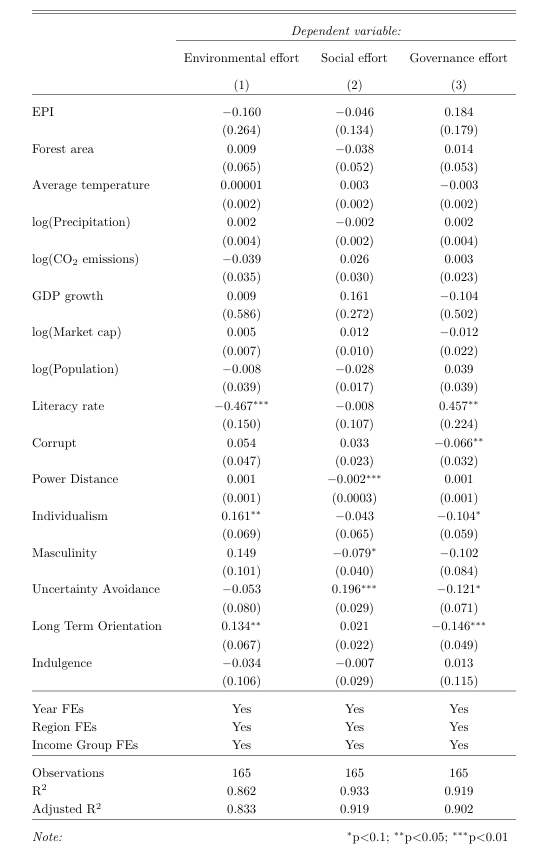
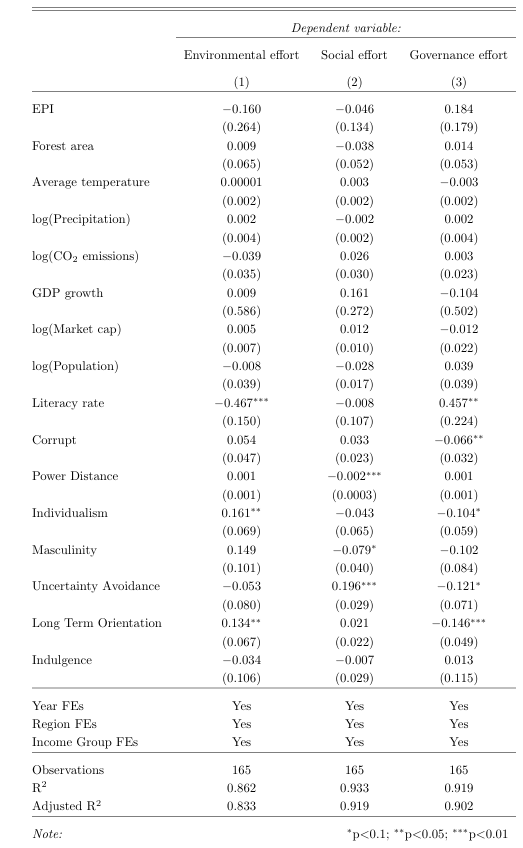
3.1 Exchanges’ focus on environmental, social, and governance
The regression results in Table 4 report the factors driving exchanges’ focus on environmental, social, and governance efforts. As described in Section 2.1, the E, S, and G effort variables represent the weight that the exchanges put in each of the three aspects for sustainability. Thus, the three variables sum to one, and an increase in one effort will decrease the other effort(s). Firstly, the estimated coefficient of literacy rate is-0.467, negative and statistically significant, for the exchanges’ environmental effort. The result suggests that a one standard deviation increase in literacy rate reduces exchanges’ focus on environmental issues by 4.2 percentage points, which represents about 14% of sample average. One possible explanation to this negative association is that more educated populations may already expect strong environmental standards, reducing the need for exchanges to focus further on these efforts. This result aligns with Esty and Porter (2005), who document that information seems to have a limited impact on environmental performance. Furthermore, literacy rate is strongly correlated with national income levels.15 Wealthier jurisdictions generally possess more advanced environmental governance structures, which may diminish the relative role of stock exchanges in driving environmental outcomes. Whereas, the estimated coefficient of literacy rate is 0.457 and statistically significant for the governance effort. A one standard deviation increase in literacy rate is associated with a 4.10 percentage points increase in governance efforts, which is equivalent to a 10.55% increase with respect to sample average. This result suggests that more educated populations demand stronger governance mechanisms.
Moreover, the result shows that corruption has a negative and significant relationship with governance effort. The estimated coefficient suggests that a one standard deviation improvement in anti-corruption measure is associated with a 1.7 percentage points (i.e., 4.40% of sample average) increase in the exchanges’ governance efforts. This result highlights the importance of governance mechanisms are important in combating corruption. On the cultural dimension, power distance and masculinity are negatively associated with social efforts, meaning that exchanges in hierarchical and more competitive societies may be less likely to emphasise social concerns. A one standard deviation increase in power distance and masculinity measures are associated with a 5 bps (0.16% of sample average) and a 1.4 percentage points (4.59% of sample average), respectively, decrease in social effort. High power distance limits inclusivity and employee involvement in decision-making, discouraging open discussion of social issues and reducing responsiveness to stakeholder concerns, while high masculinity emphasises competition and material success over cooperation and care for others, thereby diminishing firms’ motivation to engage in socially responsible initiatives (Ringov and Zollo, 2007). Regarding individualism, the results show that a one standard deviation increase leads to a 4.02 percentage points (13.42% of sample average) increase and a 2.60 percentage points (6.67% of sample average) decrease in environmental and governance efforts, respectively. These patterns are broadly consistent with the cross-cultural findings of Basabe and Ros (2005), who show that countries with higher power distance tend to exhibit lower human development, greater income inequality, and higher levels of political corruption, while individualistic societies are generally characterised by greater political freedom, lower corruption, and stronger endorsement of egalitarian values. This interpretation is further supported by Griffin et al. (2021), who find that firms in more individualistic countries tend to achieve higher environmental and social performance due to greater stakeholder emphasis on transparency, autonomy, and socially responsible conduct. Similar pattern can be observed for long term orientation. A standard deviation increase in the long-term orientation measure is associated with a 3.89 percentage points (12.95% of sample average) increase and a 4.23 percentage points (10.86% of sample average) decrease in environmental and governance efforts, respectively. This may be because long-term orientation leads stakeholders to value future benefits of ESG and exert pressure for sustainable behavior(Graafland and Noorderhaven, 2020). This finding is also consistent with evidence from Durach and Wiengarten (2017), who document that long-term oriented societies tend to pursue environmental management more systematically and strategically. Lastly, uncertainty avoidance has a strong positive influence on social efforts and a marginally significant negative impact on governance efforts. A standard deviation increase is associated with a 5.10 percentage points (16.44% of sample average) increase in social effort and a 3.15 percentage points (8.07%) decrease in governance effort. This pattern suggests that exchanges in societies that prefer structured approaches and avoid risks tend to focus more on social issues such as labor standards and equality.
Overall, the results indicate that exchanges’ focus on environmental, social, and governance efforts is influenced by a diverse set of environmental, economic, and cultural factors. Cultural dimensions such as uncertainty avoidance and long-term orientation also shape the emphasis on social and governance efforts, while economic factors such as literacy rates reveal contrasting impacts on governance and environmental priorities. These findings highlight the complexity of ESG efforts and the importance of considering both external environmental factors and internal cultural dynamics when examining how exchanges prioritise ESG issues.
Table 4. Environmental,Social, and Governance Efforts
This table presents the regression results analysing the factors influencing exchanges’ focus on Environmental (E), Social (S), and Governance (G) initiatives. The independent variables include environmental factors such as the Environmental Performance Index (EPI), CO2 emissions, forest area, and climate indicators, along with economic and cultural factors such as market capitalisation, population size, GDP growth, literacy rates, and Hofstede’s cultural dimensions. The regressions control for year, region, and income group fixed effects, and standard errors are clustered by year. Coefficients are reported with standard errors in parentheses.
3.2 Motivations behind exchanges’ ESG advancements
Figure 1 illustrates the time series dynamic of the motivations behind exchanges’ sustainability efforts from 2015 to 2023. The plots tracks four key factors: sustainability concerns, regulatory requirements, reputation, and competition, showing how the importance of each has evolved over time. The plotted values, ranging between 0 and 1, represent the proportion of exchanges reporting such ESG motivation each year.
From 2015 to 2023, sustainability concerns and reputation consistently appear as the top two motivators. Sustainability concerns started strong at 0.77 in 2015 and showed a steady upward trend, peaking at 0.91 in 2022 before slightly dipping to 0.90 in 2023. This reflects a persistent and growing awareness among exchanges of the importance of environmental and social responsibility. Reputation, while starting at a similar level in 2015 (0.77), initially declined to a low point of 0.67 in 2019 but then surged sharply, reaching 0.95 in 2023 — the highest value among all four motivations. This trend suggests that in recent years, the desire to maintain or enhance public image and stakeholder trust has become the most dominant driver behind sustainability actions.
Figure 1. Motivations
This figure plots the time series of the yearly average value of the motivations driving exchanges’ ESG advancements. The variables include (1) Sustainability concerns, (2) Regulatory requirements, (3) Reputation/public relations, and (4) Competitive concerns.
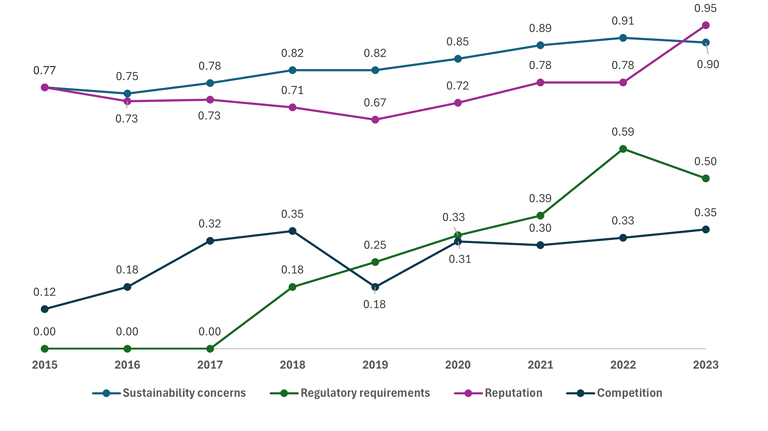
In contrast, regulatory requirements were a negligible factor at the beginning of the period, holding a value of zero through 2017. However, their importance steadily rose afterward, reaching 0.39 in 2021 and peaking at 0.59 in 2022 before slightly dropping to 0.50 in 2023. This pattern highlights how regulatory pressure has become an increasingly influential force, likely reflecting global shifts in policy, the introduction of new sustainability-related regulations, and enhanced reporting standards. Meanwhile, competition has remained the weakest motivator throughout the period. Starting from 0.12 in 2015, it increased to a peak of 0.35 in 2018 but then stabilized around 0.30–0.35 in the subsequent years, indicating that sustainability is not yet widely perceived by exchanges as a major competitive differentiator.
In addition, the regression results in Table 5 highlight the relationship between these motivations behind exchanges’ ESG advancements and other factors. For sustainability concerns (Column 1), long-term orientation and indulgence have a positive and significant impact — a one standard deviation increase in the long-term orientation and the indulgence measure increases the proportion of exchanges reporting sustainability concerns by 8.38 percentage points (10.10% of sample average) and 8.84 percentage points (10.65% of sample average), respectively. The result indicates that future-oriented societies and those that allow more personal freedom are more likely to engage in ESG initiatives driven by sustainability. This finding is supported by Benabou and Tirole (2010), who document that firms’ corporate social responsibility actions could be driven by social interests, including adopting long-term perspectives. Additionally, uncertainty avoidance negatively affects sustainability concerns, suggesting that risk-averse societies are less focused on sustainability efforts.
For regulatory requirements (Column 2), long-term orientation and indulgence again show significant positive effects. A one standard deviation increase in these measures results in an increase of 11.17 percentage points (42.94% of sample average) and 10.79 percentage points (41.50% of sample average), respectively, in the proportion of exchanges reporting regulatory requirements motivating sustainability initiatives. This result implies that societies with a long-term outlook and higher indulgence are more likely to have regulatory frameworks supporting ESG initiatives. Population size also plays a role, with larger populations showing a slight positive impact on regulatory motivations.
Reputation and public relations (Column 3) are another significant motivator behind ESG advancements.16 Power distance, individualism, indulgence, and long-term orientation positively influence exchanges’ ESG efforts driven by reputational concerns, suggesting that societies with a focus on personal accountability, personal freedom, and a long-term outlook are more concerned with maintaining a positive public image through ESG advancements. Literacy rates also show a positive relationship with reputation motivations, indicating that more educated populations drive ESG practices for reputational reasons. In addition, the estimated coefficients for GDP growth and market capitalisation are negative and statistically significant, suggesting that small exchanges, especially during worse economic conditions, are more likely be motivated by reputational reasons.
Finally, competitive concerns (Column 4) are significantly influenced by forest area and average temperature, suggesting that exchanges in jurisdictions with larger forest areas and in warmer region, adopt ESG initiatives as part of their market strategies. The estimated coefficient on masculinity is 0.636, positive and statistically significant. A one standard deviation increase in the masculinity measure is associated with a 11.45 percentage points (44.03% of sample average) increase in the likelihood of competitive motivations. Moreover, long term orientation and indulgence are positively associated with competitive motivations, whereas uncertainty avoidance has a negative association. Risk-averse societies may be less inclined to adopt ESG practices for competitive reasons.
Overall, the results indicate that exchanges are driven by a combination of environmental performance, regulatory pressures, reputational concerns, and competitive dynamics in their pursuit of ESG advancements. The significance of cultural factors, such as long-term orientation, masculinity, and power distance, further underscores the need to understand the social and institutional contexts that shape ESG motivations. This study’s findings on exchange-level ESG motivations align with Edmans, Gosling, and Jenter (2024), who show that investor ESG actions are primarily driven by financial objectives, external constraints, and client expectations. These findings provide important insights for policymakers and regulators aiming to foster ESG development across exchanges by tailoring strategies to the specific motivations and concerns present in different jurisdictions.
Table 5. Motivation
This table presents the results of four panel regressions examining the various motivations driving exchanges’ ESG advancements. The dependent variables include dummy variables indicating: (1) Sustainability concerns, (2) Regulatory requirements, (3) Reputation/public relations, and (4) Competitive concerns. Independent variables include the Environmental Performance Index (EPI) for 2014,10-year percentage change in EPI, forest area, average temperature,CO2 emissions, GDP growth, market capitalisation, population, adult literacy rate, and several cultural dimensions based on Hofstede’s model. The regressions control for year, region, and income group fixed effects, and standard errors are clustered by year. Coefficients are reported with standard errors in parentheses
3.3 Offering of ESG-related products and index inclusion
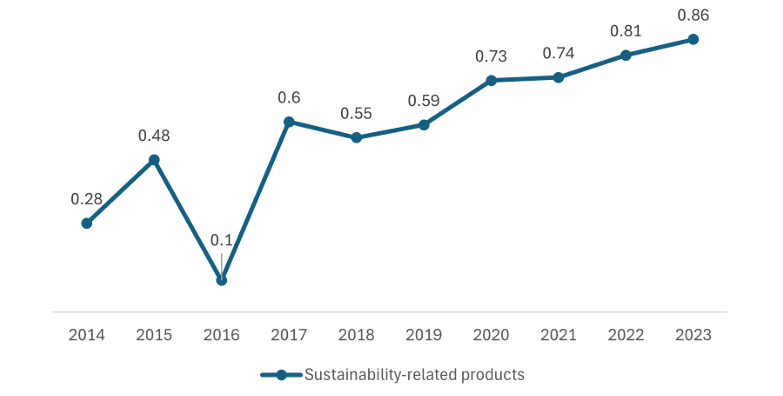
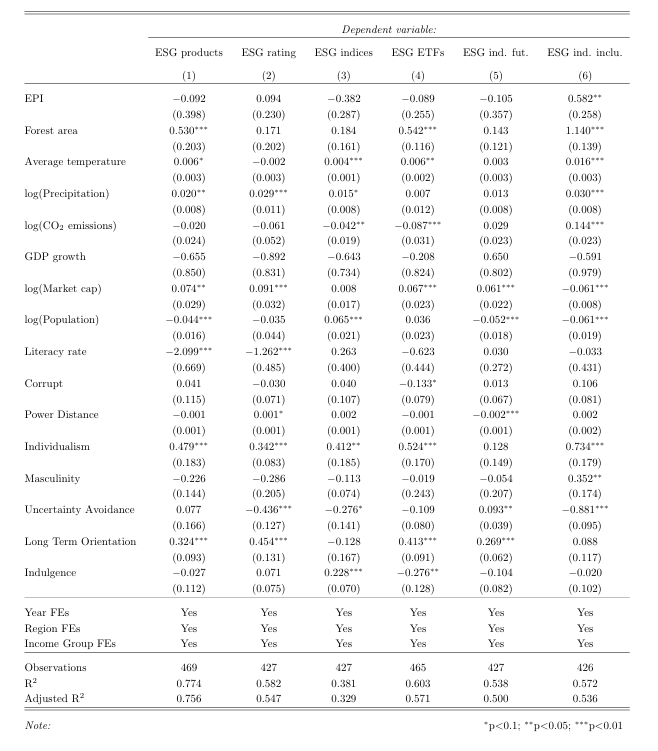
Figure 2 illustrates the dynamics of the offering of sustainability-related products from 2014 to 2023, where a value of 0 indicates that no exchange offered such products and a value of 1 indicates universal adoption across all exchanges surveyed. The data reveal a clear upward trend over the decade, despite some early volatility. In 2014, only 28% of exchanges reported offering sustainability products. However, beginning in 2017, there was a sustained and steady increase from 60% in 2017 to 86% by 2023, demonstrating a growing and persistent institutional commitment to ESG product development. The trend reflects exchanges’ evolving role as facilitators of sustainable finance and aligns with broader shifts in investor demand and regulatory expectations over the past decade. The regression estimation results for the ESG-related products are reported in Table 6. The Environmental Performance Index shows a positive and significant relationship with the inclusion of an exchange’s own stock in an ESG index (Column 6), indicating that better environmental performance is linked to greater inclusion in sustainability indices.
Figure 2. ESG-related products
This figure plots the time series of the yearly average value of the offering of sustainability-related products from 2014 to 2023
Geographical characteristics also play a significant role in the development of ESG financial products. Forest area is positively associated with the availability of sustainability-related products, ESG ETFs, and inclusion in ESG indices, suggesting that jurisdictions with larger forested areas may have a greater focus on environmental stewardship, which in turn encourages the creation of ESG products. Similarly, climate-related variables, such as average temperature and precipitation, show significant positive associations with the development of sustainability-related products, ESG ratings, ESG indices, and inclusion in ESG indices. This result implies that jurisdictions experiencing more pronounced climate variability may prioritise the creation of financial products that address environmental risks and sustainability concerns. In terms of emissions, CO2 emissions are negatively associated with the development of ESG ETFs and sustainability indices, indicating that higher emissions may inhibit the development of certain sustainability-related products. However, in contrast, inclusion in ESG indices appears positively correlated with CO2 emissions, suggesting that exchanges in jurisdictions with higher emissions may face pressure to be included in these indices to address investor demand for greater environmental accountability. This reflects a nuanced relationship between environmental performance and the creation of ESG-related financial products.
Economic factors such as market capitalization show a strong positive influence across multiple ESG product offerings. Larger financial markets appear more capable of supporting the development of these products, possibly due to better infrastructure, regulatory frameworks, and greater investor demand for sustainability-oriented investments.
Cultural dimensions based on Hofstede’s model reveal complex but important relationships with ESG product development. Higher individualism consistently shows a positive relationship with the development of various ESG products and ratings, indicating that societies where personal responsibility and accountability are emphasised tend to be more engaged in creating sustainability-related financial products. This is consistent with Griffin et al. (2021), who find that individualism fosters higher E/S performance through greater transparency and stakeholder accountability, which likely extends to greater development of ESG products or innovations in such cultures. Similarly, societies with higher long-term orientation are positively associated with the development of sustainability-related products, including ESG rating, ETFs, and futures, reflecting a future-oriented approach that values sustainability. This aligns with Saether, Eide, and Bjørgum (2021), who find that long-term orientation fosters green strategies and innovation among Norwegian maritime firms, as long-term orientation encourages investment in green innovation by promoting strategic planning and patience for returns over extended time horizons.
Conversely, uncertainty avoidance is negatively associated with offering ESG ratings, offering ESG indices, and inclusion in ESG indices, implying that societies that are more risk-averse may be less likely to innovate in the ESG space. These results underscore the multifaceted nature of ESG product development. Environmental, geographical, economic, and cultural factors all play critical roles in shaping how jurisdictions engage with sustainability-related financial markets. Policy-makers and regulators can leverage these findings to tailor strategies that promote the growth of ESG-related financial products, taking into account the unique characteristics of each jurisdiction. For example, jurisdictions with improving environmental performance or large financial markets may be better positioned to develop and expand their offerings of sustainability-related products, while cultural factors such as individualism and long-term orientation can further enhance ESG innovation.
Table 6. Products and index inclusion
This table presents the results of six panel regressions examining the determinants of various sustainability-related financial products and inclusion in ESG index across exchanges. The dependent variables include: (1) the offering of sustainability-related products, (2) the offering of ESG rankings or ratings, (3) the offering of sustainability indices, (4) the offering of ESG exchange traded funds (ETFs), (5) the offering of ESG index futures, and (6) inclusion in an ESG index. Independent variables include the Environmental Performance Index (EPI) for 2014, 10-year percentage change in EPI, forest area, average temperature, CO2 emissions, GDP growth, market capitalisation, population, adult literacy rate, and several cultural dimensions based on Hofstede’s model. The regressions control for year, region, and income group fixed effects, and standard errors are clustered by year. Coefficients are reported with standard errors in parentheses.
4 Conclusion
This study investigates the key drivers behind exchanges’ focus on ESG efforts, examining the underlying motivations as well as the development of ESG-related financial products. By analysing ten years of data from the WFE sustainability surveys and integrating environmental performance metrics, geographical characteristics, economic indicators, and cultural dimensions, the study sheds light on the complex and multifaceted factors shaping ESG initiatives across exchanges worldwide. The findings reveal that exchanges’ ESG progress is not driven by a single factor but rather emerges from the interplay of sustainability awareness, regulatory pressures, reputational concerns, and competitive dynamics — all of which are influenced by local and global contexts.
These insights offer important implications for exchanges, policymakers, regulators, and stakeholders seeking to advance ESG practices globally. For exchanges, the results emphasise the need to align ESG strategies with the socio-economic, environmental, and cultural realities of their specific jurisdictions. For example, exchanges operating in risk-averse or conservative societies may need to take a gradual, trust building approach when introducing ESG innovations, ensuring that stakeholders perceive these initiatives as credible and low-risk. Conversely, exchanges in jurisdictions with high environmental performance or strong regulatory frameworks may leverage their positioning to lead in sustainability product innovation, using ESG as a competitive advantage to attract investment and enhance market differentiation.
For policymakers and regulators, the findings suggest the importance of designing targeted, context sensitive interventions that support ESG adoption across capital markets. In markets where ESG awareness remains low, public education campaigns, governance reforms, or incentives for sustainable financial practices could stimulate demand and strengthen market readiness. Regulatory clarity and harmonisation, especially across international borders, may also help exchanges navigate the growing complexity of ESG requirements and mitigate compliance burdens.
Overall, this research highlights that advancing ESG in global capital markets requires both local adaptation and global coordination. Exchanges must tailor their ESG efforts to local needs and constraints while also engaging with international best practices and collaborative initiatives. A flexible, context sensitive approach will be crucial for building resilient, credible, and impactful ESG frameworks that respond to the evolving expectations of investors, regulators, and society at large.
References
Bagnoli, M., and S. G. Watts. 2003. Selling to socially responsible consumers: Competition and the private provision of public goods. Journal of Economics & Management Strategy 12:419–45.
Bancel, F., D. Glavas, and G. A. Karolyi. 2023. Do ESG Factors Influence Firm Valuation? Evidence from the Field. Working Paper, Available at SSRN: https://ssrn.com/abstract=4365196 or http://dx.doi.org/10.2139/ssrn.4365196.
Baron, D. P. 2010. Morally motivated self-regulation. American Economic Review 100:1299–329.
Baron, D. P., M. A. Harjoto, and H. Jo. 2011. The economics and politics of corporate social performance. Business and Politics 13:1–46.
Basabe, N., and M. Ros. 2005. Cultural dimensions and social behavior correlates: Individualism collectivism and power distance. Revue Internationale de Psychologie Sociale 18.
Benabou, R., and J. Tirole. 2006. Incentives and prosocial behavior. American Economic Review 96:165278.
———. 2010. Individual and corporate social responsibility. Economica 77:1–19.
Beugelsdijk, S., R. Maseland, and A. Van Hoorn. 2015. Are scores on hofstede’s dimensions of national culture stable over time? A cohort analysis. Global Strategy Journal 5:223–40.
Block, S., J. W. Emerson, D. C. Esty, A. de Sherbinin, Z. A. Wendling, and et al. 2024. The 2024 environmental performance index report. epi.yale.edu.
Brown, W. O., E. Helland, and J. K. Smith. 2006. Corporate philanthropic practices. Journal of Corporate Finance 12:855–77.
Cahan, S. F., C. Chen, L. Chen, and N. H. Nguyen. 2015. Corporate social responsibility and media coverage. Journal of Banking & Finance 59:409–22.
Cai, Y., C. H. Pan, and M. Statman. 2016. Why do countries matter so much in corporate social performance? Journal of Corporate Finance 41:591–609.
Cao, J., H. Liang, and X. Zhan. 2019. Peer effects of corporate social responsibility. Management Science 65:5487–503.
Cao, J., S. Titman, X. Zhan, and W. Zhang. 2023. ESG preference, institutional trading, and stock return patterns. Journal of Financial and Quantitative Analysis 58:1843–77.
Chang, M., and S. T. Lau. 2024. Stock exchange esg initiatives and corporate sustainability. SSRN Electronic Journal doi:10.2139/ssrn.4814121. Available at SSRN: https://ssrn.com/abstract=4814121 or http://dx.doi.org/10.2139/ssrn.4814121.
Crifo, P., and V. D. Forget. 2015. The economics of corporate social responsibility: A firm-level perspective survey. Journal of Economic Surveys 29:112–30.
Durach, C. F., and F. Wiengarten. 2017. Environmental management: The impact of national and organisational long-term orientation on plants’ environmental practices and performance efficacy. Journal of Cleaner Production 167:749–58. doi:10.1016/j.jclepro.2017.08.198.
Edmans, A., T. Gosling, and D. Jenter. 2024. Sustainable investing: Evidence from the field. Working Paper, FEB-RN Research Paper No. 18/2024
Edwards, C. 2020. The role of stock exchanges in esg intervention. Working Paper, Kenan Institute of Private Enterprise.
Esty, D. C., and M. E. Porter. 2005. National environmental performance: An empirical analysis of policy results and determinants. Environment and Development Economics 10:391–434.
Fernandez-Kranz, D., and J. Santal´o. 2010. When necessity becomes a virtue: The effect of product market competition on corporate social responsibility. Journal of Economics & Management Strategy 19:453–87.
Fisman, R., G. Heal, and V. B. Nair. 2007. A model of corporate philanthropy. Working Paper, Working Paper. Columbia University.
Giglio, S., M. Maggiori, J. Stroebel, Z. Tan, S. Utkus, and X. Xu. 2023. Four Facts About ESG Beliefs and Investor Portfolios. NBER Working Papers 31114, National Bureau of Economic Research, Inc.
Graafland, J., and N. Noorderhaven. 2020. Culture and institutions: How economic freedom and long-term orientation interactively influence corporate social responsibility. Journal of International Business Studies 51:1034–43. doi:10.1057/s41267-019-00301-0.
Gratcheva, E. M., T. Emery, and D. Wang. 2020. Demystifying sovereign esg. EFI Insight-Finance. Washington, DC: World Bank.
Griffin, J. M., O. Guedhami, K. Li, and P. Lu. 2021. National culture and the value implications of corporate environmental and social performance. Journal of Corporate Finance 66:101873–. doi: 10.1016/j.jcorpfin.2020.101873.
Helfaya, A., R. Morris, and A. Aboud. 2023. Investigating the factors that determine the ESG disclosure practices in Europe. Sustainability 15:5508–.
Hoepner, A. G., A. A. Majoch, and X. Y. Zhou. 2021. Does an asset owner’s institutional setting influence its decision to sign the principles for responsible investment? Journal of Business Ethics 168:389–414.
Hofstede, G. 2011. Dimensionalizing cultures: The Hofstede model in context. Online Readings in Psychology and Culture 2:8–.
Hsu, A., D. Esty, M. Levy, A. de Sherbinin, and et al. 2016. The 2016 environmental performance index report. https://doi.org/10.13140/RG.2.2.19868.90249.
Innes, R., and A. G. Sam. 2008. Voluntary pollution reductions and the enforcement of environmental law: An empirical study of the 33/50 program. The Journal of Law and Economics 51:271–96.
Karpoff, J. M., R. Litan, C. Schrand, and R. L. Weil. 2022. What ESG-related disclosures should the sec mandate? Financial Analysts Journal 78:9–18.
Krueger, P., Z. Sautner, and L. T. Starks. 2020. The Importance of Climate Risks for Institutional Investors. The Review of Financial Studies 33:1067–111. ISSN 0893-9454. doi:10.1093/rfs/hhz137.
Lanoie, P., J. Laurent-Lucchetti, N. Johnstone, and S. Ambec. 2011. Environmental policy, innovation and performance: New insights on the Porter hypothesis. Journal of Economics & Management Strategy 20:803–42.
Pan, Y., R. A. Birdsey, J. Fang, R. Houghton, P. E. Kauppi, W. A. Kurz, O. L. Phillips, A. Shvidenko, S. L. Lewis, J. G. Canadell, et al. 2011. A large and persistent carbon sink in the world’s forests. Science 333:988–93.
Ringov, D., and M. Zollo. 2007. The impact of national culture on corporate social performance. Corporate Governance: The International Journal of Business in Society 7:476–85. doi:10.1108/14720700710820551.
Roy, A., and P. Mukherjee. 2022. Does national culture influence corporate ESG disclosures? Evidence from cross-country study. Vision 09722629221074914.
Saether, E. A., A. E. Eide, and Ø. Bjørgum. 2021. Sustainability among norwegian maritime firms: Green strategy and innovation as mediators of long-term orientation and emission reduction. Business Strategy and the Environment 30:2382–95. doi:10.1002/bse.2752.
Shin, J., J. J. Moon, and J. Kang. 2023. Where does ESG pay? The role of national culture in moderating the relationship between ESG performance and financial performance. International Business Review 32:102071–.
Shleifer, A. 2004. Does competition destroy ethical behavior? American Economic Review 94:414–8.
Starks, L. T. 2023. Presidential address: Sustainable finance and ESG issues—value versus values. The Journal of Finance 78:1837–72.
Sustainable Stock Exchanges. 2019. 10 Years of Impact and Progress. Working Paper, United Nations Sustainable Stock Exchanges (SSE) Initiative.
Wasiuzzaman, S., S. A. Ibrahim, and F. Kawi. 2023. Environmental, social and governance (ESG) disclosure and firm performance: Does national culture matter? Meditari Accountancy Research 31:1239–65.
Wolf, M. J., J. W. Emerson, D. C. Esty, A. d. Sherbinin, and Z. A. Wendling. 2022. 2022 Environmental Performance Index (EPI) results. Working Paper, New Haven, CT: Yale Center for Environmental Law & Policy.
World Federation of Exchanges. 2024. The WFE’s 10th Sustainability Survey. Working Paper, World Federation of Exchanges (WFE).
Zhang, J. F., and J. Y. chow So. 2024. The effect of corruption exposure on the esg performance of multinational firms. Pacific-Basin Finance Journal 86:102433–. ISSN 0927-538X. doi:https://doi.org/10.1016/j.pacfin.2024.102433
Appendix
Drivers of exchange sustainability development: Evidence from a decade of surveys
1 Senior Financial Economist, World Federation of Exchanges. Email: [email protected]
2 Financial Economist, World Federation of Exchanges. Email: [email protected]
3 World Federation of Exchanges (2024); Chang and Lau (2024); Edwards (2020); Sustainable Stock Exchanges (2019)
4 Crifo and Forget (2015) provide a comprehensive literature review on the drivers behind firms’ corporate social responsibility (CSR) practices.
5 WFE distributes the sustainability survey at the beginning of each year to collect information for the preceding year. The first survey, distributed in 2015, collected data on the performance of each exchange member for the year 2014. The most recent survey was distributed in 2024.
6 For access to the survey reports from the past 10 years, please visit the WFE website at https://www.world-exchanges.org/our-work/research/archive/sustainability-org.
7 https://datahelpdesk.worldbank.org/knowledgebase/articles/906519-world-bank-country-andlending-groups
8 This question has only been included since the 2021 WFE Sustainability Survey
9 For more information, see https://epi.yale.edu/. Also see Wolf et al. (2022) for a discussion of the EPI.
10 For more information, see https://data.worldbank.org/
11 For more information, see https://www.world-exchanges.org/
12 https://www.transparency.org/en/
13 See https://www.theculturefactor.com
14 The Hofstede’s Cultural Dimensions have been frequently used in explaining ESG practices. For example, see Roy and Mukherjee (2022); Helfaya, Morris, and Aboud (2023); Shin, Moon, and Kang (2023); Wasiuzzaman, Ibrahim, and Kawi (2023).
15 See World Bank Sovereign ESG Data Portal: https://esgdata.worldbank.org/tools/incomeadj?lang=en&ind=EG.ELC.COAL.ZS&ind2=NY.GDP.PCAP.CD
Disclaimer:
The views, thoughts and opinions contained in this Focus article belong solely to the author and do not necessarily reflect the WFE’s policy position on the issue, or the WFE’s views or opinions.