2023 Fixed Income Index Products Annual Report
Credit Overview − Spreads, Volatility and Volumes
Introduction
The year 2023 was marked by significant events that affected global financial markets, including a bear market for most of the year, geopolitical conflicts, the U.S. regional banking crisis and the UBS acquisition of Credit Suisse. These events contributed to heightened market volatility and shifts in trading volumes across various financial instruments. This report aims to highlight the tradeable volumes in index products linked to key S&P DJI credit indices, with a focus on exchange-traded funds (ETFs), credit default swap (CDS) Indices, standardized total return swaps (TRS) and futures.
Credit Spreads and Volatility
After consistent interest rate hikes in 2022 across the U.S. and European markets, 2023 started off with expectations of interest rates peaking during the year. These expectations manifested in credit spreads tightening in the first two months of 2023, as well as a decrease in the market’s expectations of future credit volatility as indicated by the Credit VIX® indices. However, these expectations were relatively short lived, with credit spreads spiking in March 2023 due to stress in the U.S. regional banking sector and concerns related to the potential default of Credit Suisse prior to its acquisition by UBS.
As wider repercussions of the banking sector events were avoided, credit spreads recovered and set off on a consistent path of tightening over the following few months. Since April 2023, the market’s expectations of credit volatility across the North American and European investment grade and high yield credit markets have been on a downward trend, barring a brief period in October, which saw a rise in credit spreads and expected credit volatility.
Overall, spreads across all major credit markets ended the year tighter, driven by the U.S. Federal Reserve Bank and the European Central Bank halting interest rate hikes in the second half of 2023 and the market pricing in potential interest rate cuts in 2024.
The charts in Exhibit 1 illustrate the progression of credit spreads over the course of 2023 across global credit markets, as indicated by the relevant iTraxx/CDX index spreads and the iBoxx bond index option-adjusted spreads. For the U.S. and European markets, the relevant Credit VIX indices indicate the market’s expectations of credit volatility over the following one- month period.
Exhibit 1: Progression of Credit Spreads over 2023 across Global Credit Markets
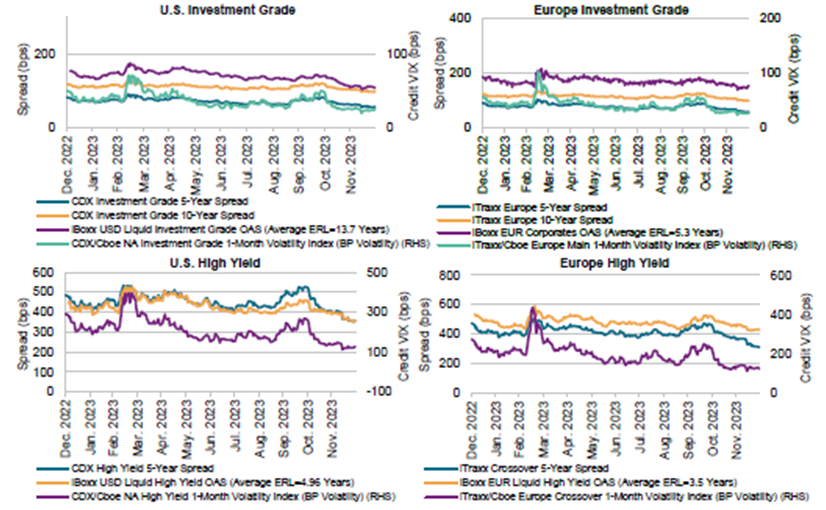
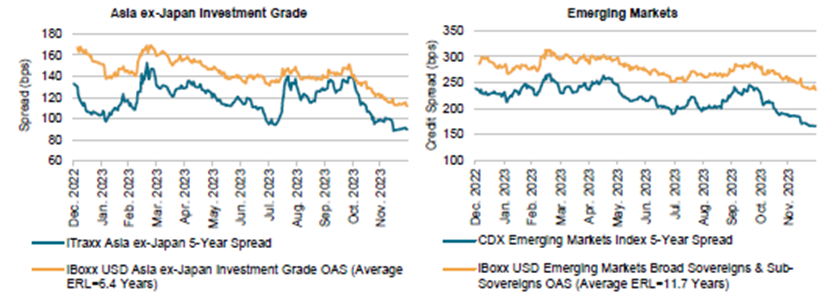
Source: S&P Dow Jones Indices LLC, Credit VIX - Indices | S&P Dow Jones Indices (spglobal.com), iBoxx Indices Web (ihsmarkit.com), S&P Global Market Intelligence. Data from Dec. 30, 2022, to Dec. 31, 2023. OAS stands for option-adjusted spread. ERL stands for expected remaining life. The CDX/Cboe NA Investment Grade 1-Month Volatility Index (BP Volatility), iTraxx/Cboe Europe Main 1-Month Volatility Index (BP Volatility), CDX/Cboe NA High Yield 1-Month Volatility Index (BP Volatility) and iTraxx/Cboe Europe Crossover 1-Month Volatility Index (BP Volatility) were launched Oct. 13, 2023. All data prior to index launch date is back-tested hypothetical data. Past performance is no guarantee of future results. Charts are provided for illustrative purposes and reflect hypothetical historical performance.
Trading Volumes of Key Credit Index Products
ETFs
Fixed income ETFs have continued to gain popularity as versatile investment vehicles due to benefits that include liquidity, diversification and tax efficiency. In 2023, ETFs linked to key iBoxx USD and EUR corporate bond indices saw significant trading activity.
ETF trading volumes linked to the iBoxx USD Liquid High Yield Index and iBoxx USD Liquid Investment Grade Index in 2023 were $748 billion and $563 billion, respectively. The aggregate $1,311 billion in traded volumes in 2023 was down approximately 15% versus $1,543 billion in 2022. However, 2022’s record volumes were driven by exceptional fixed income volatility, with 2023 still representing the second-highest year in terms of trading volumes over the past five years.
CDS Indices
After a record year of iTraxx/CDX index trading volumes in 2022, iTraxx/CDX indices posted another strong year, with an estimated $27.5 trillion notional traded in 2023. While 2023 volumes were lower by about 23% relative to 2022, they were still up 10% relative to the 2021 volumes, indicating a consistent upward trajectory since 2015. iTraxx/CDX indices are among the most liquid credit derivatives in the market and they continue to play a major role in the credit liquidity ecosystem.
CDS Index Options
iTraxx/CDX swaptions posted record volumes in 2023, trading just shy of an estimated $10 trillion in notional, up 33% relative to 2022. iTraxx/CDX swaptions have historically proven to be highly liquid instruments that may be used to gain exposure to or hedge credit volatility. With the October 2023 launch of the Credit VIX Indices, which reference these iTraxx/CDX swaptions, the market gained a robust measure for tracking expected volatility in credit markets.
CDS Index Tranches
Like iTraxx/CDX swaptions, 2023 proved to be a record year for iTraxx/CDX tranches with an estimated $335 billion notional traded, up 51% from 2022. The annual percentage increases in 2023 were higher for tranches on the iTraxx Europe Index and iTraxx Crossover Index, posting increases of 69% and 56%, respectively, compared to tranches on CDX North America Investment Grade and CDX North America High Yield, which posted increases of 23% and 30%, respectively. The uncertainty in credit markets in 2023 appeared to provide opportunities for market participants to benefit from correlation trading, as well as access or hedge specific parts of the credit default curves.
CDS Notional Outstanding
CDS index products continued to show significant market presence, with an estimated notional outstanding of over $7.6 trillion as of year-end 2023, representing over 70% of all CDS notional outstanding, up from about 51% as of year-end 2016. The overall CDS notional outstanding has stayed consistent in recent years, hovering in the $10-12 trillion range, closing 2023 at $10.8 trillion.
Standardized TRS on iBoxx Indices
Standardized Total Return Swaps (TRS) on iBoxx indices traded an estimated $137 billion in notional in 2023. Trading volumes in 2023 were slightly lower than 2022’s record year of USD 153 billion. However, they were still marginally up from 2021’s trading volume of $134 billion.
iBoxx USD indices saw an estimated USD 111 billion of notional traded in 2023 across investment grade, high yield and leveraged loan indices, down 11% from 2022. It is worth noting that standardized TRS volumes on iBoxx USD Liquid Investment Grade Index almost doubled from $17 billion in 2022 to $32 billion in 2023.
Futures on iBoxx Indices
Futures contracts tracking the iBoxx iShares USD Corporate Bond Indices are intended to provide a means for market participants to gain beta exposure to the USD corporate bond market in an unfunded manner, either long or short. These futures are exchange traded, so they offer continuous pricing as well as favorable tax treatment of the futures wrapper. These contracts also allow investors to express views on the high yield and investment grade USD corporate bond markets.
iBoxx index futures trading volumes for 2023 showed a sizable year-over-year decrease ($19 billion versus $56 billion). This reflects a change from quarterly to monthly settlement, but not necessarily a pure reduction of activity. Last year, open interest increased in both high yield and investment grade. 2023 saw advances in the futures market linked to iBoxx indices, with the launch of options related to the futures tracking iBoxx indices.
Conclusion
Fixed income indices and tradeable products tracking them continue to modernize the bond markets. They provide transparency and a bond market standardization method, as well as offering single-point tools. Robust volumes, relatively tighter bid-ask spreads to underlying bonds and tradeable tools linked to key market measures underscore index tools' benefits.
As the fixed income ecosystem evolves, how can S&P DJI’s Credit VIX Indices further enhance transparency and efficiency? Read more: Credit VIX®: A New Tool for Measuring and Managing Credit Risk
Performance Disclosure/Back-Tested Data
The CDX/Cboe NA Investment Grade 1-Month Volatility Index (BP Volatility), iTraxx/Cboe Europe Main 1-Month Volatility Index (BP Volatility), CDX/Cboe NA High Yield 1-Month Volatility Index (BP Volatility) and iTraxx/Cboe Europe Crossover 1-Month Volatility Index (BP Volatility) were launched Oct. 13, 2023. All information presented prior to an index’s Launch Date is hypothetical (back-tested), not actual performance, and is based on the index methodology in effect on the index launch date. However, when creating back-tested history for periods of market anomalies or other periods that do not reflect the general current market environment, index methodology rules may be relaxed to capture a large enough universe of securities to simulate the target market the index is designed to measure or strategy the index is designed to capture. For example, market capitalization and liquidity thresholds may be reduced. In addition, forks have not been factored into the back-test data with respect to the S&P Cryptocurrency Indices. For the S&P Cryptocurrency Top 5 & 10 Equal Weight Indices, the custody element of the methodology was not considered; the back-test history is based on the index constituents that meet the custody element as of the Launch Date. Complete index methodology details are available at www.spglobal.com/spdji. Back-tested performance reflects application of an index methodology and selection of index constituents with the benefit of hindsight and knowledge of factors that may have positively affected its performance, cannot account for all financial risk that may affect results and may be considered to reflect survivor/look ahead bias. Actual returns may differ significantly from, and be lower than, back-tested returns. Past performance is not an indication or guarantee of future results.
Please refer to the methodology for the Index for more details about the index, including the manner in which it is rebalanced, the timing of such rebalancing, criteria for additions and deletions, as well as all index calculations. Back-tested performance is for use with institutions only; not for use with retail investors.
S&P Dow Jones Indices defines various dates to assist our clients in providing transparency. The First Value Date is the first day for which there is a calculated value (either live or back-tested) for a given index. The Base Date is the date at which the index is set to a fixed value for calculation purposes. The Launch Date designates the date when the values of an index are first considered live: index values provided for any date or time period prior to the index’s Launch Date are considered back-tested. S&P Dow Jones Indices defines the Launch Date as the date by which the values of an index are known to have been released to the public, for example via the company’s public website or its data feed to external parties. For Dow Jones-branded indices introduced prior to May 31, 2013, the Launch Date (which prior to May 31, 2013, was termed “Date of introduction”) is set at a date upon which no further changes were permitted to be made to the index methodology, but that may have been prior to the Index’s public release date.
Typically, when S&P DJI creates back-tested index data, S&P DJI uses actual historical constituent-level data (e.g., historical price, market capitalization, and corporate action data) in its calculations. As ESG investing is still in early stages of development, certain datapoints used to calculate S&P DJI’s ESG indices may not be available for the entire desired period of back-tested history. The same data availability issue could be true for other indices as well. In cases when actual data is not available for all relevant historical periods, S&P DJI may employ a process of using “Backward Data Assumption” (or pulling back) of ESG data for the calculation of back-tested historical performance. “Backward Data Assumption” is a process that applies the earliest actual live data point available for an index constituent company to all prior historical instances in the index performance. For example, Backward Data Assumption inherently assumes that companies currently not involved in a specific business activity (also known as “product involvement”) were never involved historically and similarly also assumes that companies currently involved in a specific business activity were involved historically too. The Backward Data Assumption allows the hypothetical back-test to be extended over more historical years than would be feasible using only actual data. For more information on “Backward Data Assumption” please refer to the FAQ. The methodology and factsheets of any index that employs backward assumption in the back-tested history will explicitly state so. The methodology will include an Appendix with a table setting forth the specific data points and relevant time period for which backward projected data was used.
Index returns shown do not represent the results of actual trading of investable assets/securities. S&P Dow Jones Indices maintains the index and calculates the index levels and performance shown or discussed but does not manage actual assets. Index returns do not reflect payment of any sales charges or fees an investor may pay to purchase the securities underlying the Index or investment funds that are intended to track the performance of the Index. The imposition of these fees and charges would cause actual and back-tested performance of the securities/fund to be lower than the Index performance shown. As a simple example, if an index returned 10% on a US $100,000 investment for a 12-month period (or US $10,000) and an actual asset-based fee of 1.5% was imposed at the end of the period on the investment plus accrued interest (or US $1,650), the net return would be 8.35% (or US $8,350) for the year. Over a three-year period, an annual 1.5% fee taken at year end with an assumed 10% return per year would result in a cumulative gross return of 33.10%, a total fee of US $5,375, and a cumulative net return of 27.2% (or US $27,200).
Disclaimer:
The views, thoughts and opinions contained in this Focus article belong solely to the author and do not necessarily reflect the WFE’s policy position on the issue, or the WFE’s views or opinions.