Market capitalisation
In this article, we analyse the trends in the domestic equity market capitalisation observed over the past year. The data is available on the WFE Statistics Portal, while the indicators are defined in our Definitions Manual. For questions or feedback about this article, please contact the WFE Statistics Team at [email protected]
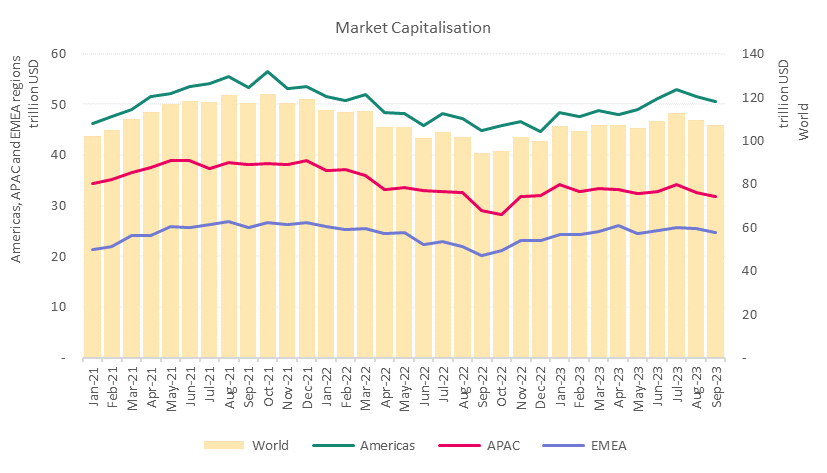
At the end of Q3 2023 the domestic equity market capitalisation stood at 107 trillion USD. This figure marked a modest 1.8% decrease from the preceding quarter, Q2 2023, while displaying a substantial 13.7% surge when compared to Q3 2022. This value closely mirrors the market's standing in January (107 trillion USD), March (107.1 trillion USD) and April 2023 (107.4 trillion USD). It should be noted that at the end of Q3 2022 domestic market capitalisation was at its lowest (94.1 trillion USD) in the period from January 2021 to September 2023.
Regionally, the Americas accounted for 47% of the market capitalisation, APAC for 30% and EMEA for the remaining 23%, respectively.
Figure 1: Market capitalisation between Jan 2021 – Sept 2023

The quarter-on-quarter decrease at the end of Q3 2023 was driven by all regions: the Americas (-1.2%), APAC (-3.1%) and EMEA region (-1.4%), respectively.
Year-on-year, we noticed the opposite trend with all regions growing: the Americas 12.5%, APAC 9.4% and EMEA region 22.6%, respectively.
Exchanges recording double digit increases in domestic market capitalisation year-on-year are: Nasdaq-US (24%), Japan Exchange Group (20.9%), Deutsche Borse AG (28.7%), SIX Swiss Exchange (12%), Nasdaq Nordic and Baltics (18.7%), Korea Exchange (25.5%) among other.
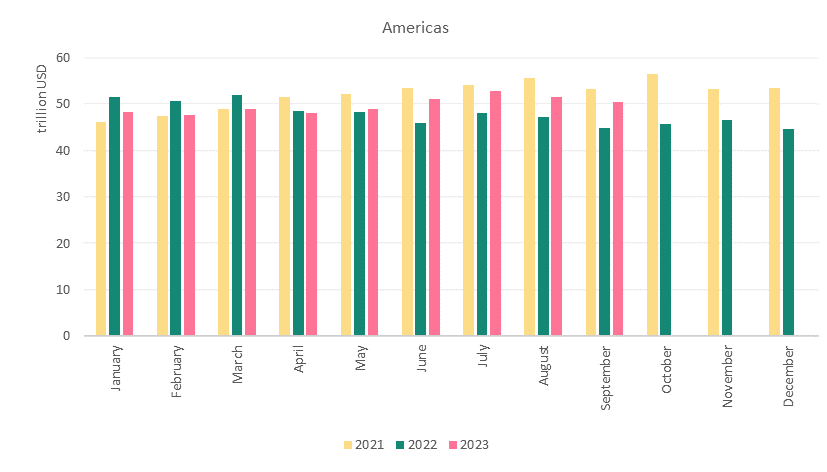
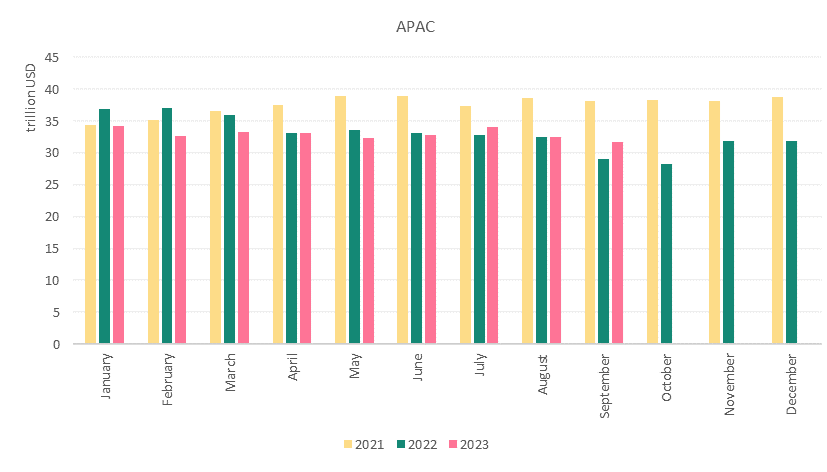
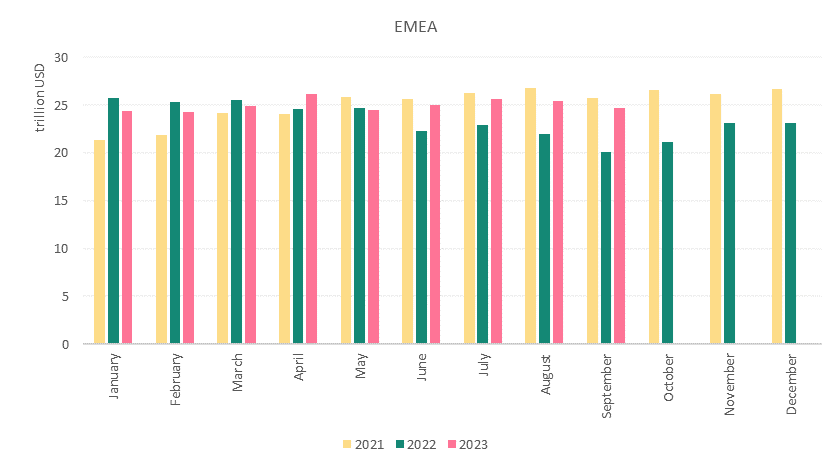
The regional number of listed investment funds is illustrated in Figures 2-4.
Figure 2: Market capitalisation between Jan 2021 – Sept 2023 in the Americas region

Figure 3: Market capitalisation between Jan 2021 – Sept 2023 in the APAC region

Figure 4: Market capitalisation between Jan 2021 – Sept 2023 in the EMEA region
