The Shrinking Demand and Supply in the Voluntary Carbon Markets
Written by Dr Ying Liu, Financial Economist at the WFE
Voluntary carbon markets are the markets where carbon credits, also known as carbon offsets, are traded. Carbon credits are issued by entities whose projects can reduce or remove greenhouse gas (GHG) emissions from the atmosphere. Each carbon credit represents one ton of CO2 (tCO2e), or equivalent GHG emission that has been (or will be) reduced or removed. The carbon projects utilize various technologies to reduce the emission of carbon into the atmosphere (for example, transitioning to renewable energy, building improved cookstoves to replace or minimize the use of firewood for cooking), or to remove carbon out of the atmosphere (for example, reforestation or investing in technology that filters CO2 out of the atmosphere).
To certify their validity, the issuance of carbon credits must currently be validated by an independent registry. The registry is also responsible for tracking and retirement of carbon credits. To retire a carbon credit means the holder of the credit claims the offset of carbon credits against its own emission. Once the credit is retired, it will no longer be traded in the voluntary carbon market.
In this note, we will examine the demand and supply trends in the voluntary carbon markets using the data provided by the Berkeley Carbon Trading Project, which contains all carbon credits projects issued and credits retirement by four major voluntary offset project registries .
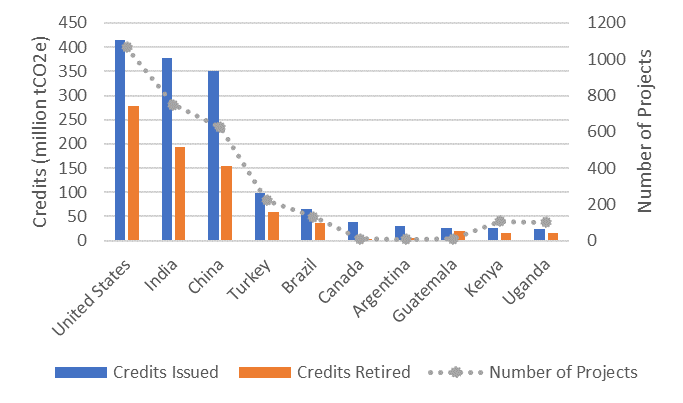
To begin with, Figure 1 depicts the top 10 countries that have issued the most carbon credits. The blue bar represents the total credits issued by projects in different countries, the orange bar denotes the amount of carbon credits retired from the projects, and the gray dotted line illustrates the number of projects. We observe that the primary sources of carbon credit origination are developing countries, together with the United States and Canada. United States ranks the first in terms of total carbon credit issuance and number of carbon projects, followed by India and China.
Figure 1 Top 10 countries of carbon credits issuance

Data Source: Voluntary Registry Offsets Database, Berkeley Carbon Trading Project (with data through May 10, 2023)
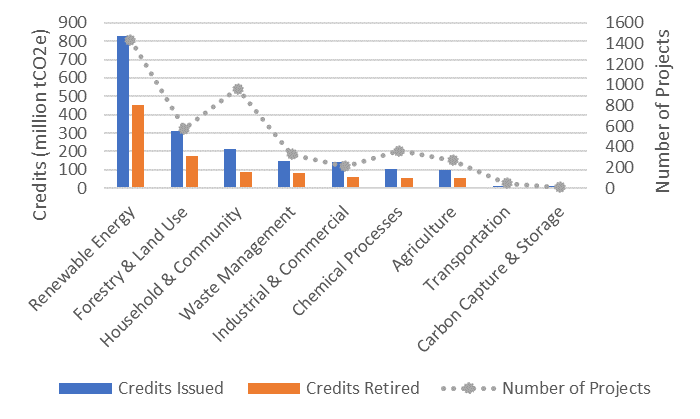
Figure 2 depicts the total issuance and retirement of carbon credits, as well as the number of projects categorized by the scope of project. There are nine different project categories. Renewable Energy projects play a dominant role in terms of both total credits issuance and number of projects. Forestry & Land Use projects issued the second-highest number of credits, followed by Household & Community projects. However, Household & Community projects surpass Forestry & Land Use projects in terms of the number of projects. This suggests that the Household & Community projects typically exhibit smaller scales.
Figure 2 Issuance and Retirement of carbon credits by scope of projects

Data Source: Voluntary Registry Offsets Database, Berkeley Carbon Trading Project (with data through May 10, 2023)
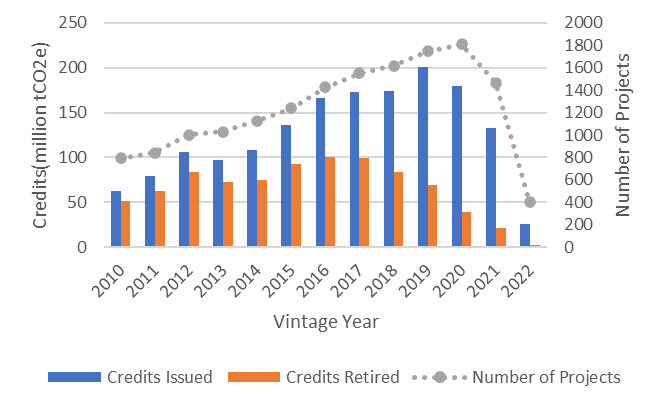
The dynamics of carbon credit supply and demand exhibit different patterns over time. Figure 3 presents the amount of issued credits, retired credits, and the number of projects of vintage year 2010 to 2022. The vintage year of carbon credit refers to the year in which the emission reduction or removal occurred, and each carbon project may have multiple vintage years. The number of carbon projects exhibits a steady increase from 2010 to 2020, followed by a sharp decline in the year 2022. The amount of carbon credits shows a similar pattern, with the reduction starting one year earlier in 2020. The retirement of carbon credits shows an even earlier decline starting in the year 2018. Notably, the total amount of retired credit of vintage year 2022 is approximately 2 million tCO2e.
Figure 3 The demand and supply of carbon credits by vintage year

This figure plots the amount of issued carbon credits, the retired credits, and the number of projects of each vintage year. Data Source: Voluntary Registry Offsets Database, Berkeley Carbon Trading Project (with data through May 10, 2023)
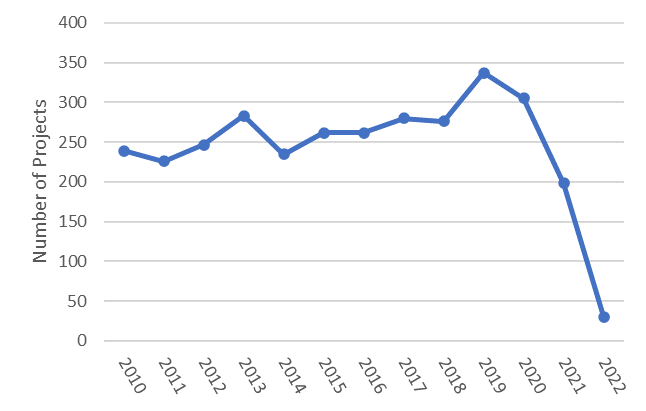
Note that the issuance and retirement of carbon credits may lag its vintage year, as the issuance and verification processes take time. Carbon credits of recent vintage years may still be under the process of verification. To further investigate the dynamics of carbon credits supply, Figure 4 illustrates the number of new carbon projects per year. From 2010 to 2018, the number of new carbon projects per year distributes around 250. In 2019, there is a surge in the number of new projects, which is followed by a consistent decline from 2020.
Figure 4 The number of new carbon projects

Data Source: Voluntary Registry Offsets Database, Berkeley Carbon Trading Project (with data through May 10, 2023)
The shrink of voluntary carbon market may be attributed to several factors. Firstly, the quality of carbon projects has been an increasing concern for investors. For example, a recent study has shown that more than 90% of rainforest carbon offsets by the biggest registry Verra are worthless. Secondly, regulators and carbon market advisory bodies are limiting the scope of their use by companies. For example, from next year, the EU Parliament plans to ban the use of environmental claims based solely on carbon offsetting schemes. Identifying the main drivers of the decrease in supply and demand in these markets will be the topic of future research.
This report is part of the ongoing WFE Research project on the voluntary carbon markets. If you have any questions or comments, please contact Ying Liu ([email protected]).
Reference
Ivy S. So, Barbara K. Haya, Micah Elias. (2023, December). Voluntary Registry Offsets Database, Berkeley Carbon Trading Project, University of California, Berkeley.