Stock index options and futures volumes
In this article, we analyse the trends in stock index options and futures contracts traded observed over the past year. The data is available on the WFE Statistics Portal, while the indicators are defined in our Definitions Manual. For questions or feedback about this article, please contact the WFE Statistics Team at [email protected]
The number of stock index options and futures contracts traded in H1 2023 amounted to 34.50 billion, which represented a 42.3% rise from H2 2022. This is due to stock index options volumes going up 51.9%, while stock index futures declined 8.8%. Regionally, volumes in the APAC region increased 52%, the EMEA recorded an uptick (+0.1%), while the Americas region decreased 6.8%.
When compared to H1 2022 the increase was more pronounced (+80.8%), due to options volumes surging 106.1%, while futures recorded a 13.4% decline.
As Figure 1 shows, most of the trades take place on APAC markets (89%), mostly on the National Stock Exchange of India, while the Americas and EMEA markets account for 9% and 2%, respectively.
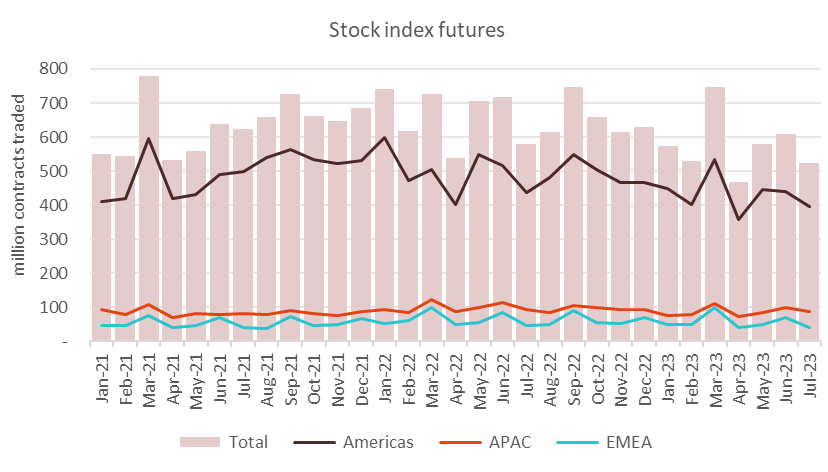
Stock index options account for 90% of the stock index derivatives contracts traded, with stock index futures accounting for the rest of 10%.
Among all derivatives, stock index options are the most traded contracts (with 55.3% share), while stock index futures are the fourth, with 6.2% share.
Within equity derivatives, 74.7% are stock index options, 8.4% stock index futures, 11.2% single stock options and 5.6% single stock futures.
Figure 1: Number of contracts traded of stock index options and futures between Jan 2021 - Jul 2023
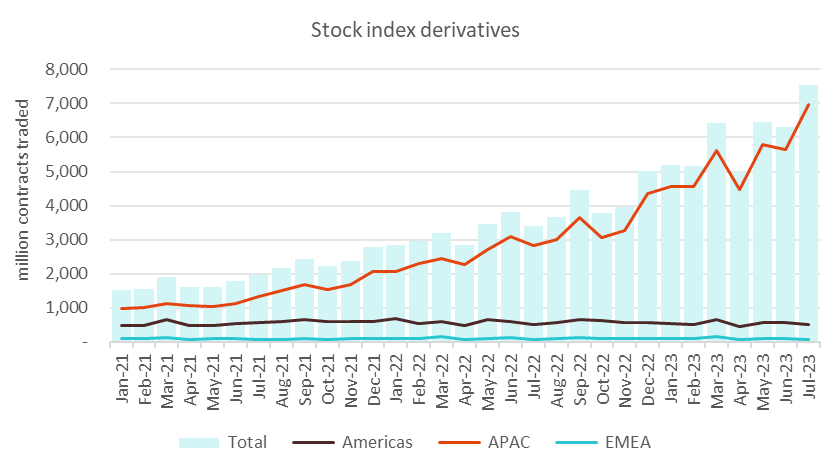
Figure 2: Number of contracts traded of stock index options between Jan 2021 - Jul 2023
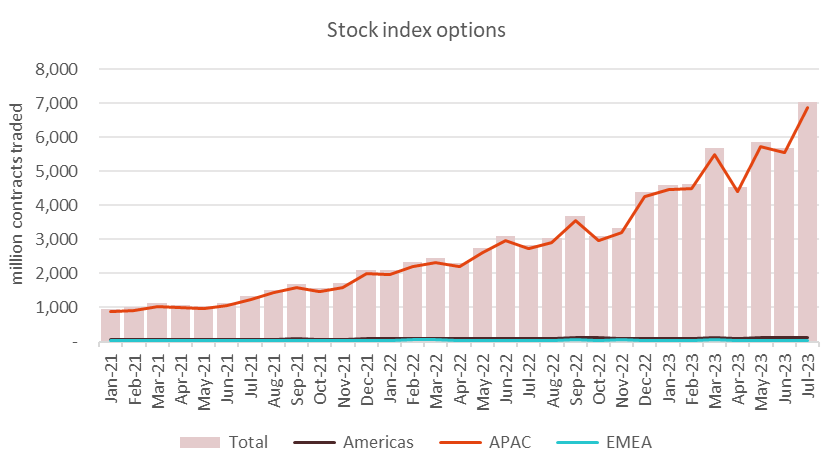
Figure 3: Number of contracts traded of stock index futures between Jan 2021 - Jul 2023
Quarter-on-quarter, in Q2 2023 volumes increased 5.9%, due to options going up 7.9%, while futures declined 10.5%.
Regionally, the Americas and EMEA regions went down in Q2 2023 when compared with Q1 2023 8.6% and 22.6%, while APAC region rose 8.2%.
When compared with Q2 2022, the volumes increased significantly (75.4%) driven by the APAC region (+97%), while the Americas and EMEA regions fell 10% and 14.6%, respectively.
Regional volumes are illustrated in Figures 4-6.
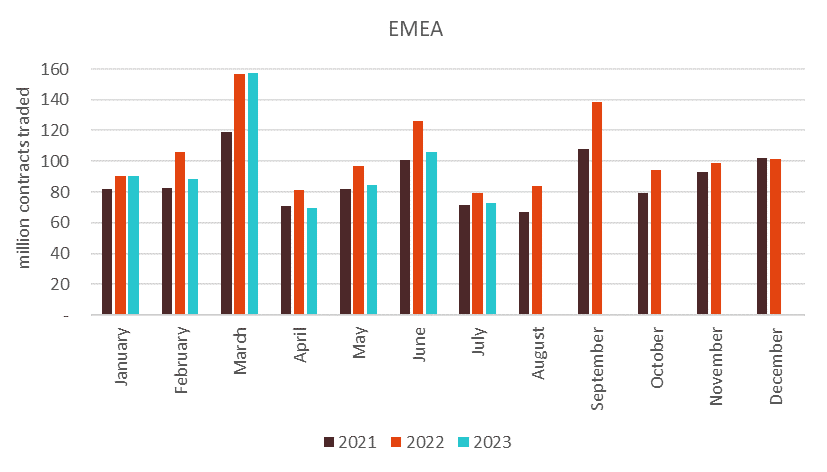
Figure 4: Stock index derivatives contracts traded in the Americas region between Jan 2021 - Jul 2023
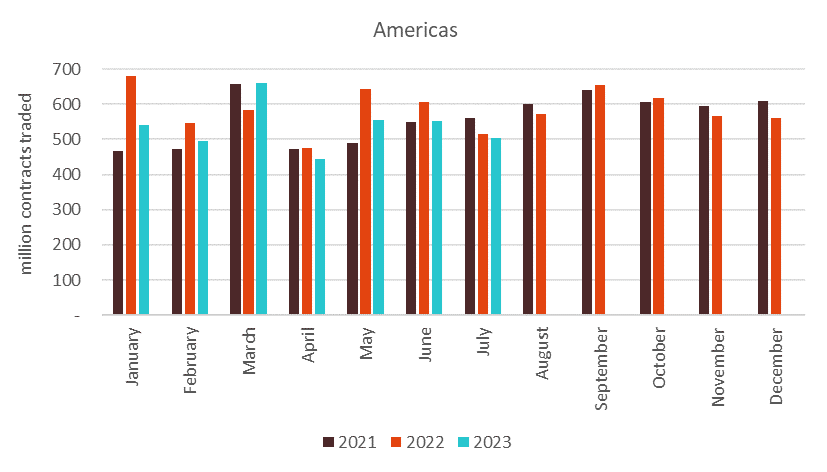
Figure 5: Stock index derivatives contracts traded in APAC region between Jan 2021 - Jul 2023
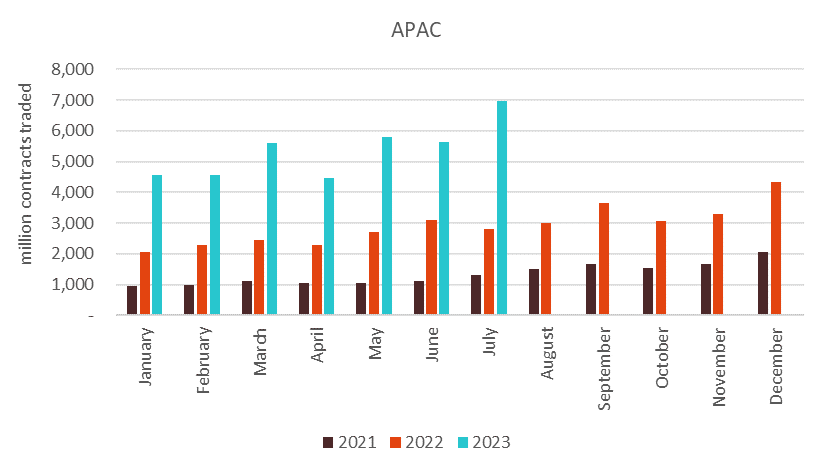
Figure 6: Stock index derivatives contracts traded in EMEA region between Jan 2021 - Jul 2023