Sustainability Bonds Trends
In this article, we look at the trend in exchange-traded sustainability bonds in the past year. The data is available on the WFE Statistics Portal, while the indicators are defined in our Definitions Manual. For questions or feedback about this article, please contact the WFE Statistics Team at [email protected]
Sustainability bonds are fixed income securities issued by corporations or governments to raise funds for new and existing projects with positive social or environmental outcomes.
The number of sustainability bonds listed in the world markets in Q3 2025 reached 1,277, which represents a 1.8% increase on Q2 2025 as seen in Figure 1. While the Americas and EMEA went up 4.5% and 2.6%, respectively, APAC region went down 1.4%.
Most sustainability bonds are listed in the EMEA region (76%), followed by APAC (22.2%), while the Americas region accounts only for 1.8%.
Figure 1: Number of sustainability bonds listed by region between May 2021 and Sept 2025. The dotted line shows the global linear trend.
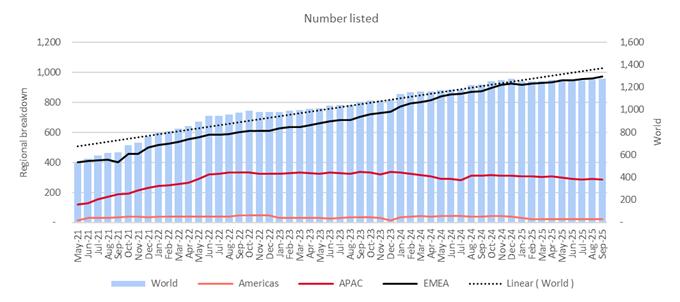
Figure 1 shows the steady increase in the number of listings on aggregate. However, while EMEA has a positive trend, APAC and the Americas regions show a slightly decreasing trend since June 2022.
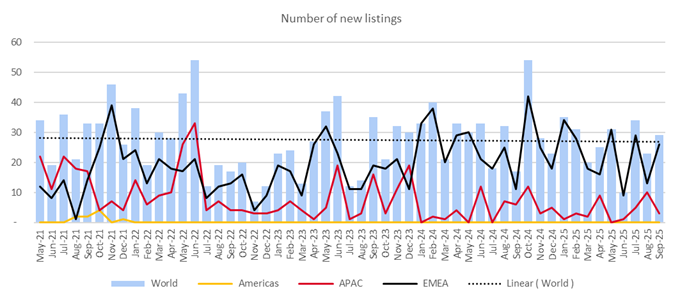
With regards to sustainability bonds new listings, these amounted to 238 in the first three quarters of 2025, registering a 7.4% decline compared to the same period in 2024. This was due to EMEA region which decreased 9.3%, while in APAC region rose 6.3%.
Most of the sustainability bonds new listings took place in EMEA (79.1%), while the rest took place in APAC region (Figure 2).
Figure 2: Sustainability bonds new listings between May 2021 and Sept 2025
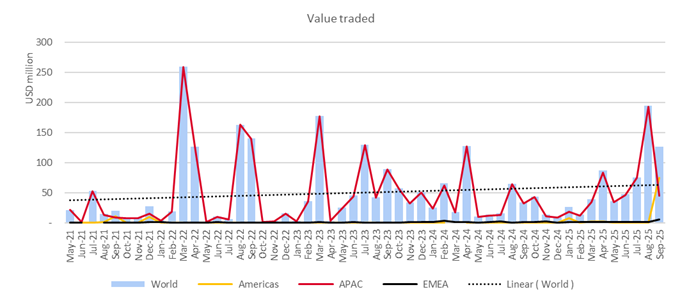
Regarding sustainability bonds value traded, it amounted to 396.2 million USD in Q3 2025, representing a 133.1% surge due to all regions rising.
It is worth noting that the value traded is dominated by the APAC region, which has 78.9% of the value traded, while the Americas and EMEA regions account for 18.9% and 2.1%, respectively. The value traded is also a very volatile indicator[PG1] [MC2] , with months of high value followed by months of almost zero value traded (Figure 3).
Figure 3: Sustainability bonds value traded by region between May 2021 and Sept 2025
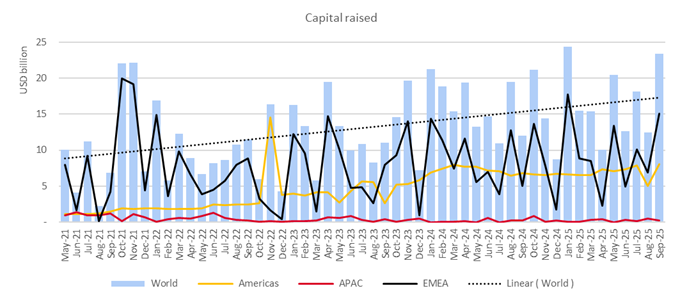
With regards to capital raised, this amounted to 152.2 billion USD in the first three quarters of 2025, representing a 4.8% increase compared to the same period in 2024. This outcome was possible due to the APAC (49.5% up) and EMEA regions (11.4% up), while the Americas declined (4%).
Regionally, 59.5% of the capital was raised on EMEA markets, 38.8% on markets in the Americas region, while APAC accounted only for 1.6% (as shown in Figure 4).
Figure 4: Capital raised with sustainability bonds between May 2021 and Sept 2025
In the four years period showed in the charts we observe a positive trend in the number of sustainability bonds listed, the value traded, and the capital raised, suggesting more funds are being directed towards the improvement of social and environmental issues.
For more WFE statistical reports, please click here.
For our research papers on emerging markets, SMEs, sustainability, technology etc, please click here.
For our regulatory affairs papers on clearing, cross-border, market integrity, market structure, risk or technology, please click here.
[1] The full WFE 11th Annual Sustainability Survey is available on our website https://www.world-exchanges.org/our-work/articles/wfes-11th-sustainability-survey