Market capitalisation
In this article, we analyse the trends in the size of the financial market, measured by the total market capitalisation of the exchange-listed securities, in 2021 compared to 2020.
The data is taken from the WFE Statistics Portal. The definition of our indicators can be found in the WFE Definitions Manual.
The total market capitalisation of all the listed securities in the exchanges around the globe was 124.5 USD trillion at the end of 2021, which represented a 16.9% increase on 2020, a 4.1% increase on H1 2021 and a 4.8% increase on Q3 2021.
Comparing the regions, we see that Americas accounted for 46% of the global market capitalisation, APAC for 32% and EMEA for the rest 22%.
In Sept 2021 we notice a drop in market capitalisation in the Americas region, with several exchanges in the region experiencing a decrease in market capitalisation.
Figure 1: Market capitalisation between Jan 2019 – Dec 2021
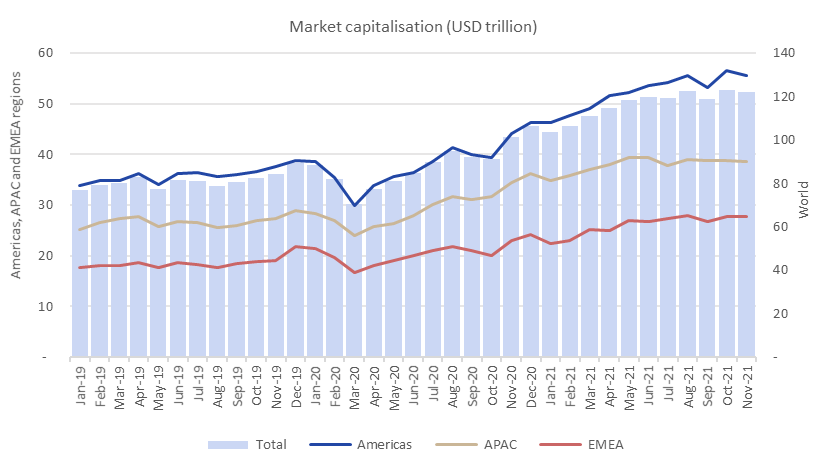
The year on year increase at the end of 2021 was due to all regions recording a higher market capitalisation: the Americas by 24.2%, the APAC by 9% and the EMEA region by 14.9%, respectively.
Compared to the first half of the year, the Americas rose 7%, APAC by only 0.2% and EMEA region by 4.1%.
Compared to Q3 2021, the Americas went up 7.6%, while APAC and EMEA regions by 1.8% and 3.5%, respectively.
Month on month, in Dec 2021 the market capitalisation went up by 2.1%, due to all regions experiencing a rise. The Americas grew the most (3.2%), followed by APAC (2%) and EMEA region (0.2%).
Table 1 shows quarterly values for market capitalisation during the Covid-19 pandemic and the year before and the quarter on quarter % change.
Table 1: Quarterly market capitalisation between 2019-2021
| Region | 2019 | 2020 | 2021 | |||||||||
| Q1 | Q2 | Q3 | Q4 | Q1 | Q2 | Q3 | Q4 | Q1 | Q2 | Q3 | Q4 | |
| World | 80.27 | 81.63 | 80.42 | 89.57 | 70.56 | 84.56 | 91.99 | 106.49 | 111.21 | 119.61 | 118.82 | 124.51 |
| Americas | 34.89 | 36.22 | 36.01 | 38.81 | 29.99 | 36.51 | 39.88 | 46.19 | 49.04 | 53.62 | 53.3 | 57.36 |
| APAC | 27.31 | 26.76 | 26.02 | 28.94 | 23.96 | 28.02 | 31.04 | 36.15 | 37.06 | 39.33 | 38.7 | 39.39 |
| EMEA | 18.07 | 18.65 | 18.39 | 21.82 | 16.61 | 20.03 | 21.06 | 24.14 | 25.12 | 26.67 | 26.82 | 27.75 |
| Region | Q2/Q1 '19 | Q3/Q2 '19 | Q4/Q3 '19 | Q1'20/ Q4'19 | Q2/Q1 '20 | Q3/Q2 '20 | Q4/Q3 '20 | Q1'21/ Q4'20 | Q2/Q1 '21 | Q3/Q2 '21 | Q4/Q3 '21 |
| World | 1.70% | -1.50% | 11.40% | -21.20% | 19.80% | 8.80% | 15.80% | 4.40% | 7.60% | -0.70% | 4.80% |
| Americas | 3.80% | -0.60% | 7.80% | -22.70% | 21.70% | 9.20% | 15.80% | 6.20% | 9.30% | -0.60% | 7.60% |
| APAC | -2.00% | -2.80% | 11.20% | -17.20% | 16.90% | 10.80% | 16.50% | 2.50% | 6.10% | -1.60% | 1.80% |
| EMEA | 3.20% | -1.40% | 18.70% | -23.90% | 20.60% | 5.20% | 14.60% | 4.00% | 6.20% | 0.60% | 3.50% |
Exchanges with an excellent performance at the end of Q4 2021 compared to Q3 2021 were: Colombo Stock Exchange (31.2%), Namibian Stock Exchange (28%), Hanoi Stock Exchange (22.9%), Cyprus Stock Exchange (21.8%), Bolsa de Valores de Lima (21.2%), Taipei Exchange (15.7%), Tel-Aviv Stock Exchange (15.1%), SIX Swiss Exchange (11.1%), Nasdaq- US (10%).
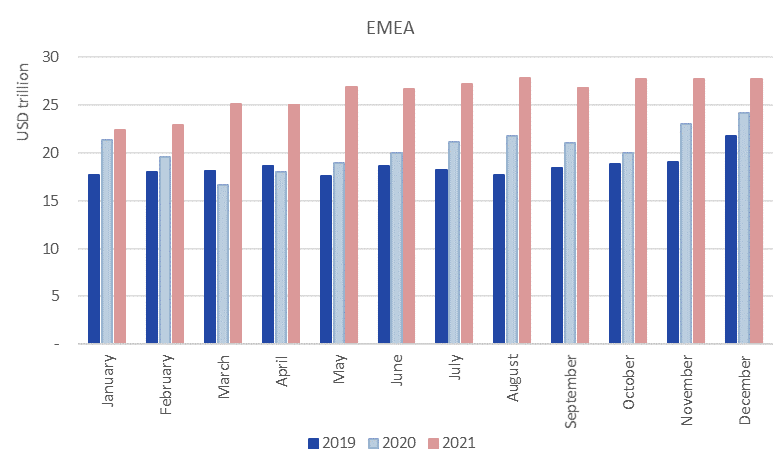
The regional market capitalisation is illustrated in Figures 2-4.
Figure 2: Market capitalisation between Jan 2019 – Dec 2021 in the Americas region
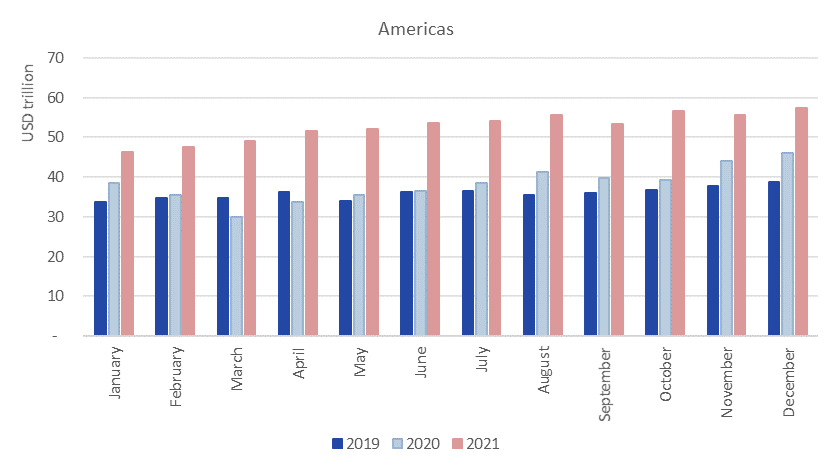
Figure 3: Market capitalisation between Jan 2019 – Dec 2021 in the APAC region
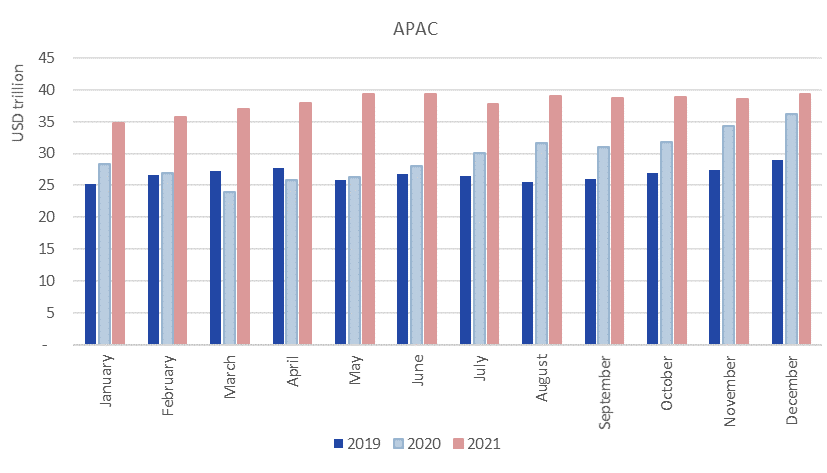
Figure 4: Market capitalisation between Jan 2019 – Dec 2021 in the EMEA region