Securitised derivatives
In this article, we analyse the trends in securitized derivatives observed over the last year, utilizing data available on the WFE Statistics Portal. The indicators used in our analysis are defined in our Definitions Manual. Should you have any questions or feedback about this article, please feel free to contact the WFE Statistics Team at [email protected].
Securitised derivatives products are tradable financial instruments that are specifically designed to meet the need of investors and respond to different investment strategies. These products incorporate non-standard features and are commonly used for capital protection, hedging against exposure to national or foreign equities, indices variations, commodity and currency prices, arbitrage strategies, directional trading, and more. It is important to note that each securitised derivatives product has its own unique set of characteristics. In addition, they are generally issued by intermediaries different from the issuer of the underlying financial instruments. Examples of securitised derivatives products include covered warrants and certificates, among others.
The number of securitised derivatives listed on the world markets in Q1 2023 reached 3.48 million, which represents a 6.1% increase on Q4 2022 (QoQ) and 6.4% increase on Q1 2022 (YoY) as seen in Figure 1.
Most securitised derivatives are listed in the EMEA region (98.8%), with APAC accounting for the rest, while in the Americas region the number is negligible.
QoQ: EMEA region listed 6.2% more securitised derivatives, while APAC and the Americas regions declined 0.8% and 14.9%, respectively.
YoY: we notice the same regional trend, with EMEA going up 6.8%, while APAC and the Americas regions fell 19.6% and 36.1%, respectively.
Figure 1: Number of securitised derivatives listed by region between January 2021 and March 2023
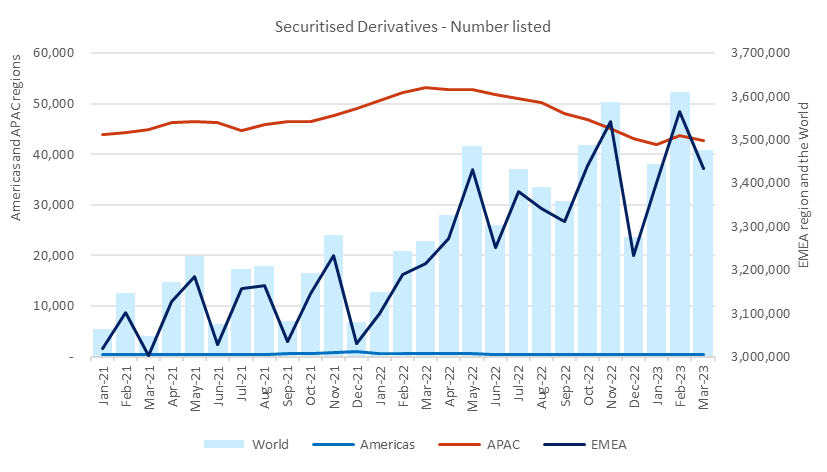
Figure 2: Securitised derivatives listed in the Americas region between January 2021 and March 2023
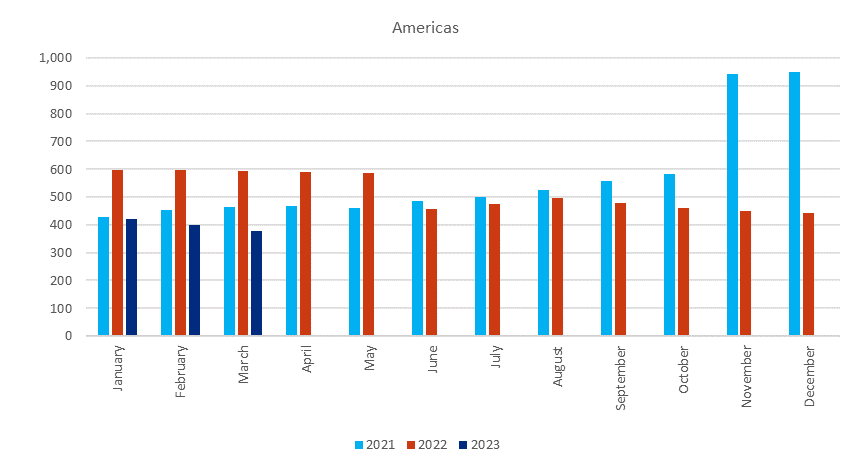
Figure 3: Securitised derivatives listed in the APAC region between January 2021 and March 2023

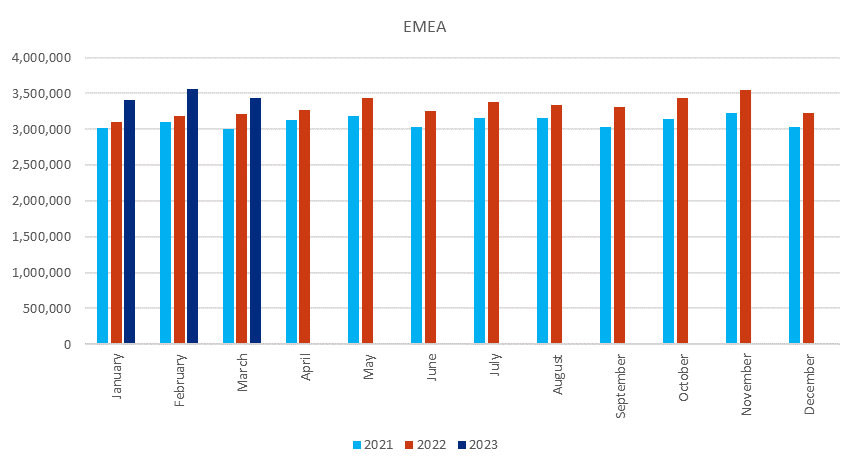
Figure 4: Securitised derivatives listed in the EMEA region between January 2021 and March 2023
Although most securitised derivatives are listed in the EMEA region, regarding securitised derivatives value traded EOB, APAC markets account for 81.7%, with the rest (18.3%) being traded on EMEA markets. The Americas region’s share is negligible (Figure 5).
Figure 5: Securitised derivatives value traded EOB between January 2021 and March 2023
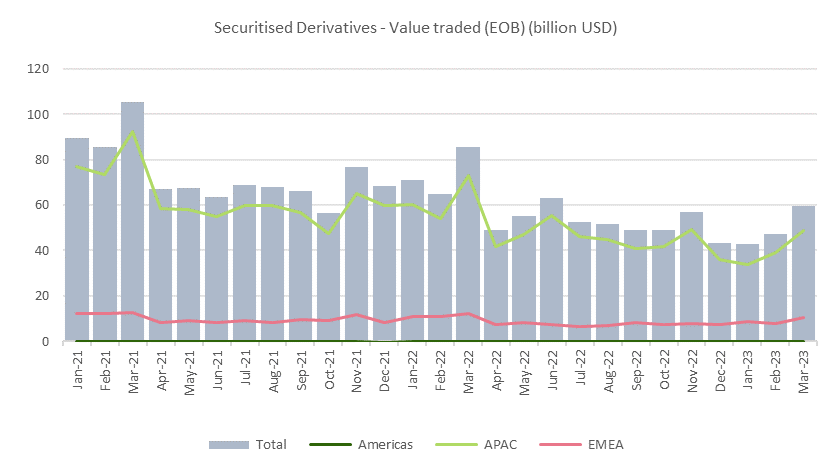
Value traded EOB reached 149.19 billion USD in Q1 2023, representing a 0.1% decrease QoQ, result due to APAC region going down 3.8%, while EMEA region rose 20.7%.
YoY: we notice a pronounced decline (-32.7%) due to both APAC and EMEA regions falling 35% and 20.3%, respectively.
Figure 6: Securitised derivatives value traded EOB in the Americas region between January 2021 and March 2023
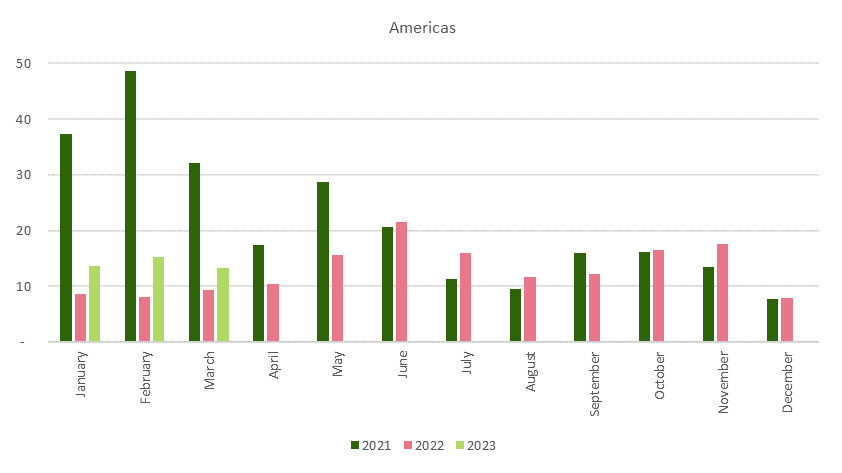
Figure 7: Securitised derivatives value traded EOB in the APAC region between January 2021 and March 2023
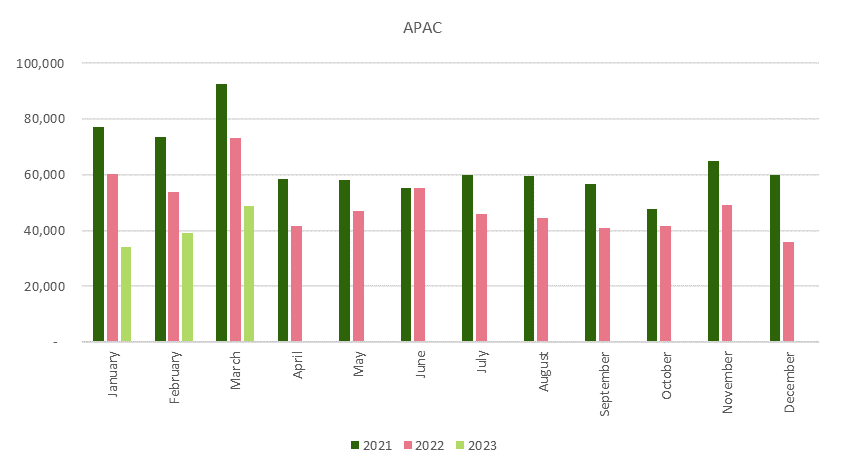
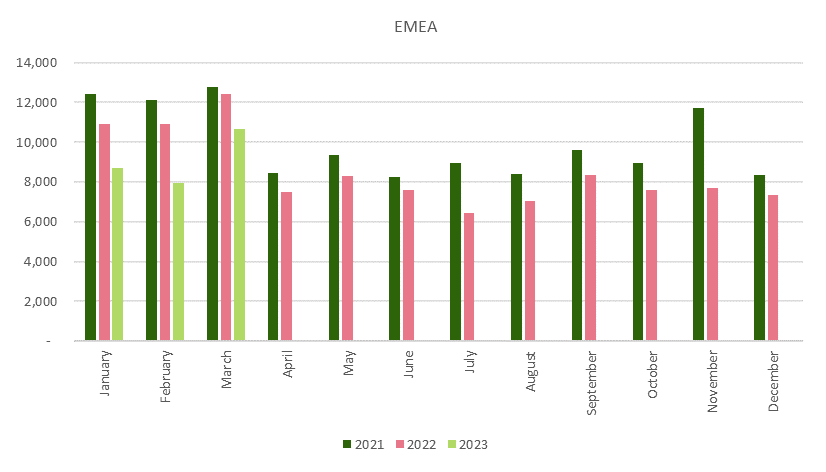
Figure 8: Securitised derivatives value traded EOB in the EMEA region between January 2021 and March 2023
