Trends in value of share trading through Electronic Order Books (EOB)
In this article, we analyse the recent trends in value of share trading through Electronic Order Books (EOB). The data is available on the WFE Statistics Portal, while the indicators are defined in our Definitions Manual. For questions or feedback about this article, please contact the WFE Statistics Team at [email protected].
The value of share trading EOB in Q1 2025 was 42.72 trillion USD, which represented a 2.7% decline on Q4 2024 and 19.5% increase on Q1 2024 (Figure 1).
The value of domestic shares traded represents 96% of the value traded EOB, while the value of foreign shares traded accounts for the rest of 4%.
As Figure 1 shows, most of the value is traded in the Americas region (52%), followed by APAC (41%), the rest of 7% being traded in the EMEA region.
54% of the value traded EOB domestic takes place on APAC markets, 39% on markets in the Americas region and the rest of 6% on EMEA markets (Figure 2).
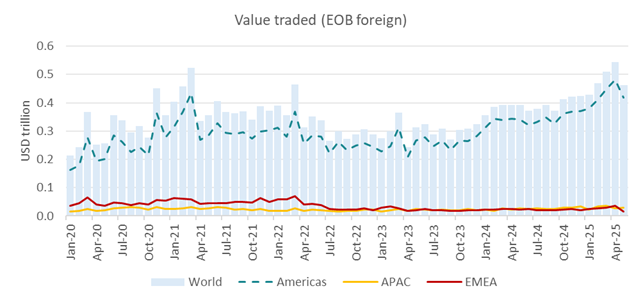
Regarding foreign value traded, 88% takes place on markets in the Americas region, 6% on APAC markets and 6% on EMEA markets.
Figure 1: Value traded EOB total between January 2020 - May 2025
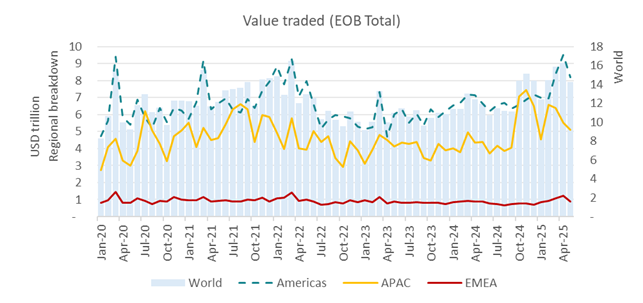
Note: The sum of the value traded EOB domestic and the value traded EOB foreign equals less than the value traded EOB total because some exchanges could not provide the breakdown and submitted only the total amount.
Figure 2: Value traded EOB domestic between January 2020 - May 2025
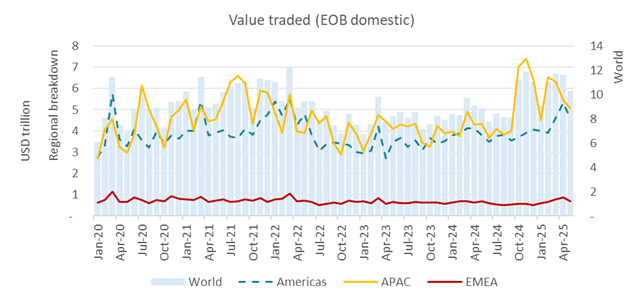
Figure 3: Value traded EOB foreign between January 2020 - May 2025
Year-to-date[1], the value of share trading EOB amounted to 73.20 trillion USD, of which 40.06 trillion USD was traded in the Americas region, 28.16 in APAC and 4.98 in EMEA region.
Quarter-on-quarter, in Q1 2025 value of share trading EOB went down 2.7%, due to APAC declining 16.6%, while the Americas and EMEA increased 8.3% and 27.2%, respectively.
In H2 2024 the value of share trading EOB total rose 9.8% (reaching 77.71 trillion USD), when compared to H1 2024, due to APAC region increasing 31.4%, while the Americas and EMEA fell 0.3% and 16.4%, respectively. When compared to H2 2023 the increase is even more pronounced (+21.8%), observed across the Americas (+13.9%) and APAC regions (+40.3%), while EMEA went down (-10.6%).
In 2024 the value of share traded EOB rose 15.4% compared to 2023, amounting to 148.48 trillion USD, due to the Americas and APAC regions rising 15.1% and 20.4%, while EMEA region recorded a negative trend (-6.8%).
Exchanges that recorded double digit increases in value traded EOB in Q1 2025 compared to Q4 2024 were: Hong Kong Exchanges and Clearing (26.6%), Cboe Europe (33.8%), Deutsche Boerse AG (49.4%), Borsa Istanbul (18.5%), SIX Swiss Exchange (23.7%), Nasdaq Nordic and Baltics (21%) among other.
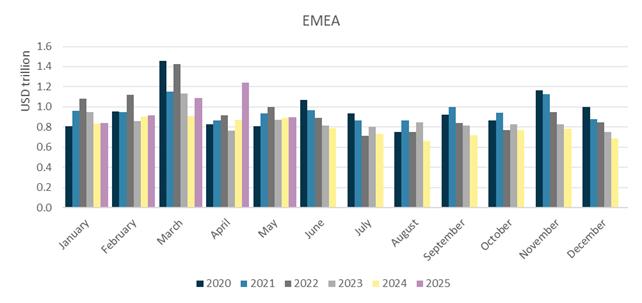
The value of share trading EOB in each region is illustrated in Figures 4-6.
Figure 4: Value of share trading EOB total in the Americas region between January 2020 - May 2025
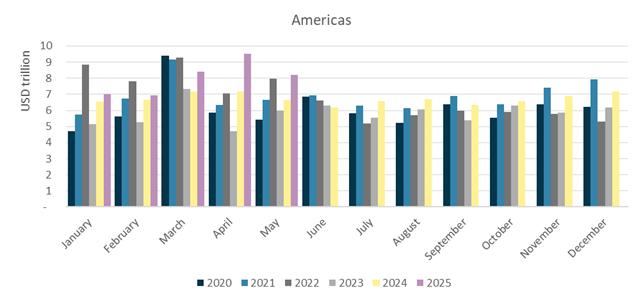
Figure 5: Value of share trading EOB total in APAC region between January 2020 - May 2025
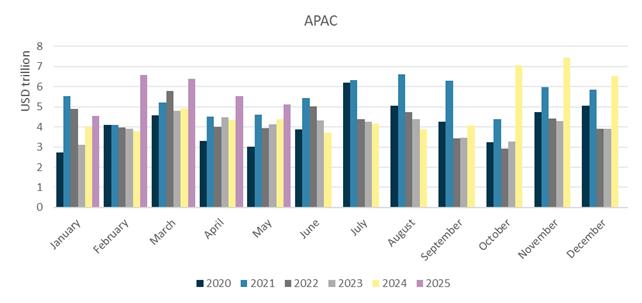
Figure 6: Value of share trading EOB total in EMEA region between January 2020 - May 2025
[1] January to May 2025