Investment funds value traded
In this article, we analyse the trends in investment funds value traded in recent years. In order to achieve a more complete view of market activity, the total value traded is split according to the facility / means used to execute the trade, namely Electronic Order Book (EOB), and Negotiated Deals.
The data is available on the WFE Statistics Portal, while the indicators are defined in our Definitions Manual. For questions or feedback about this article, please contact the WFE Statistics Team on [email protected]
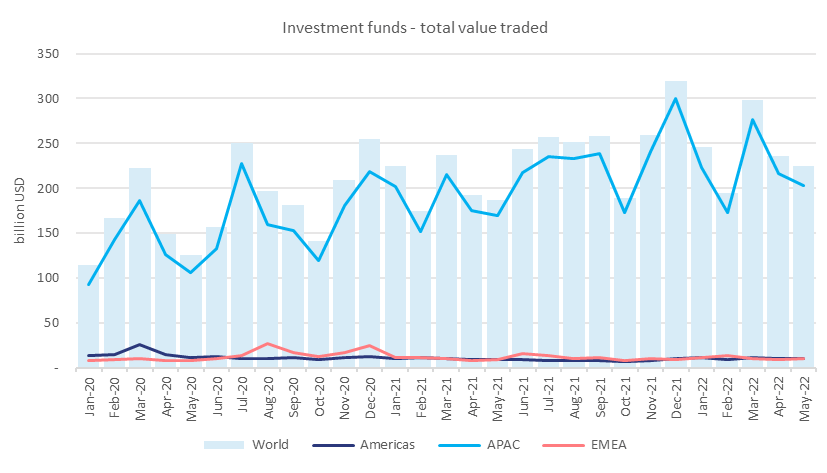
In 2021 the total value traded in investment funds across the world was 2.80 trillion USD, which represented a 28.8% increase relative to 2020. This result was driven by APAC region, which rose 38.2%, while the Americas and EMEA declined 29.6% and 20.3%, respectively. Most of the value was traded in the APAC region (91%), and only 5% in EMEA and 4% in the Americas (Figure 1).
Figure 1: Investment funds total value traded between Jan 2020 – May 2022
In Q1 2022, the amount of investment funds value traded declined 3.7% compared to the previous quarter, amounting to 739.5 billion USD. The APAC region fell 5.8%, while the Americas and EMEA regions went up 25% and 22.5%, respectively.
When comparing Q1 2022 with Q1 2021, we notice a 16.4% increase. The APAC and EMEA regions recorded an increase in activity by 18.1% and 3.1%, respectively, while the Americas registered a 0.4% downtick.
The exchanges with the highest value traded in investment funds year-to-date were: Shanghai Stock Exchange (1 trillion USD), Japan Exchange Group (58.9 billion USD) and Nasdaq-US (45.2 billion USD).
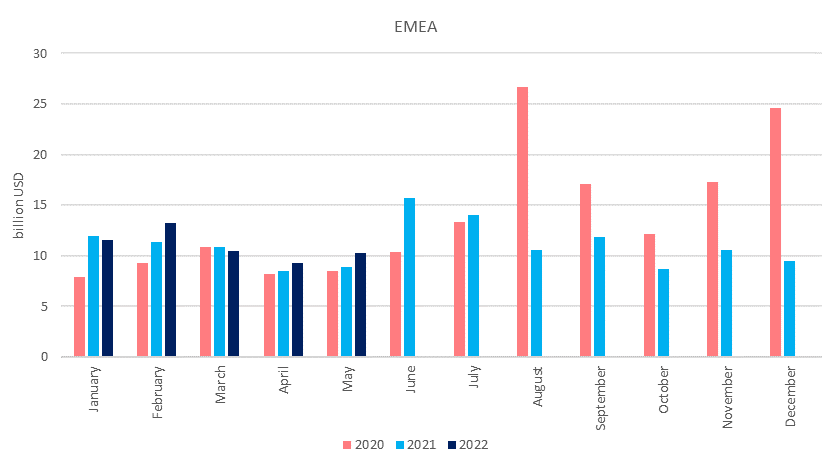
The investment funds total value traded by region is illustrated in Figures 2-4. In Figure 2 we notice that the Americas region recorded the highest value traded in March 2020, a month in which we saw spikes in market volatility. In EMEA and APAC however, while March 2020 shows some increase, the highest points were reached in August 2020 and in December 2021, respectively.
Figure 2: Investment funds total value traded between Jan 2020 – May 2022 in the Americas region
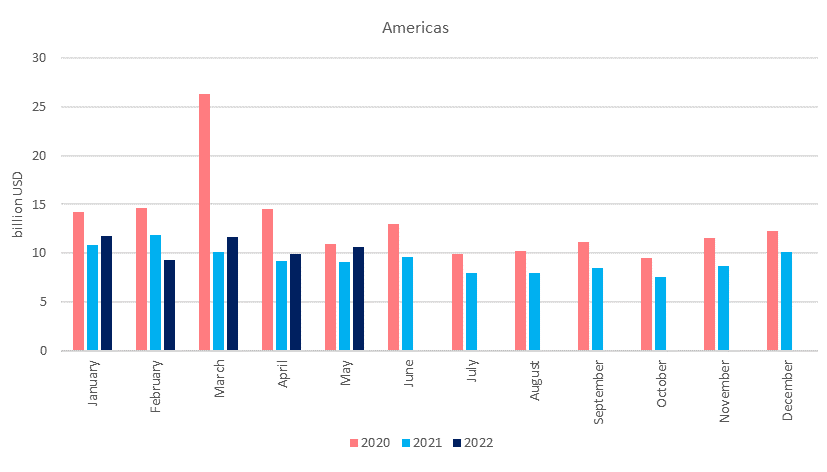
Figure 3: Investment funds total value traded between Jan 2020 – May 2022 in the APAC region
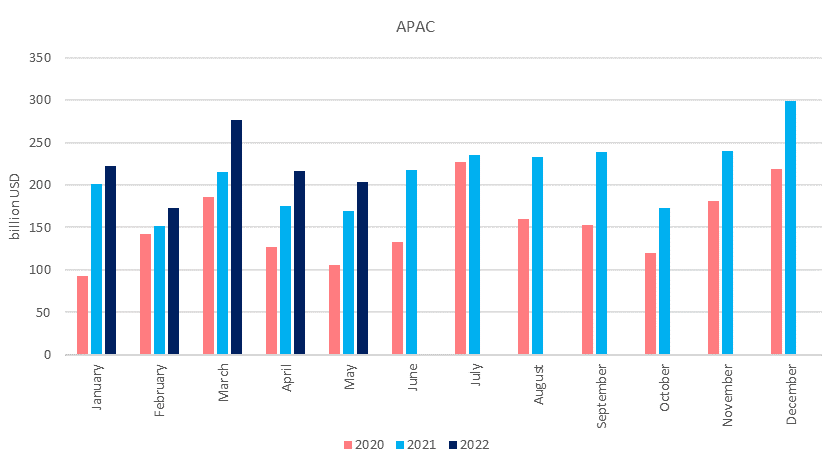
Figure 4: Investment funds total value traded between Jan 2020 – May 2022 in the EMEA region
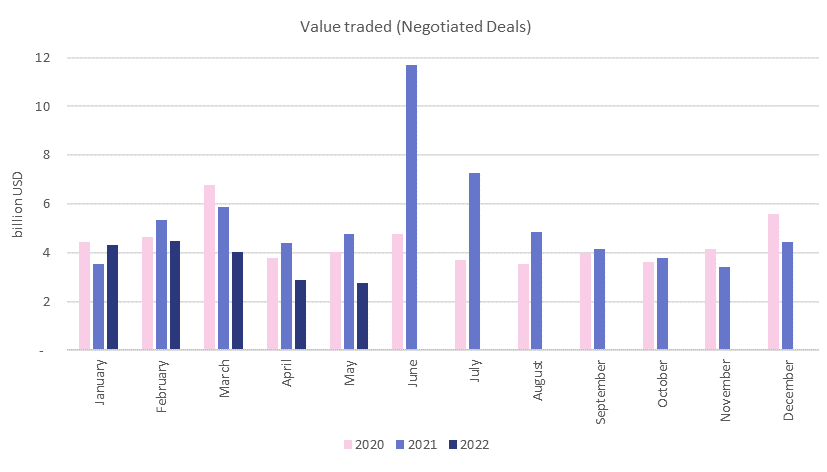
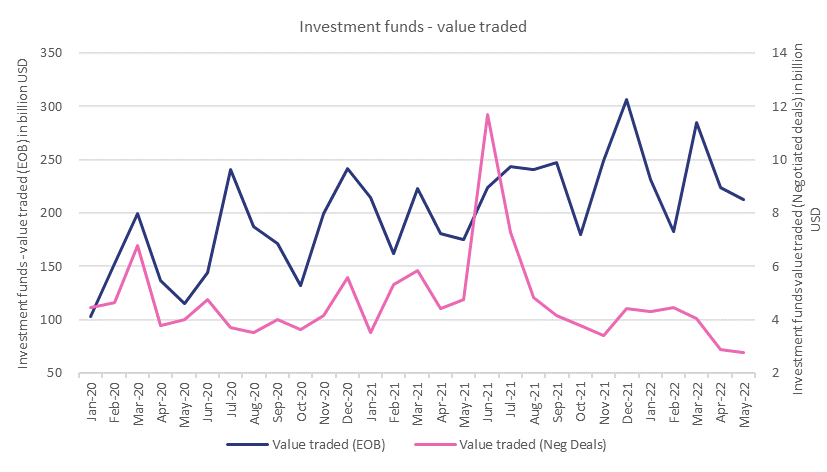
With regards to the split between EOB and negotiated deals, year-to-date (Jan-May 2022) there were 1.1 trillion USD traded through EOB (98% share) and only 18.5 billion USD traded through negotiated deals (2% share). In fact, compared with EOB, the value traded through Negotiated Deals has remained small (Figure 5). Figures 6 - 7 present the evolution value traded EOB and negotiated deals between Jan 2020 – May 2022. Please note that the total value traded total is sometimes higher than the sum of the value traded (EOB) and negotiated deals as some exchanges cannot provide the breakdown.
Figure 5: Investment funds value traded EOB and negotiated deals between Jan 2020 – May 2022
Figure 6: Investment funds value traded EOB between Jan 2020 – May 2022
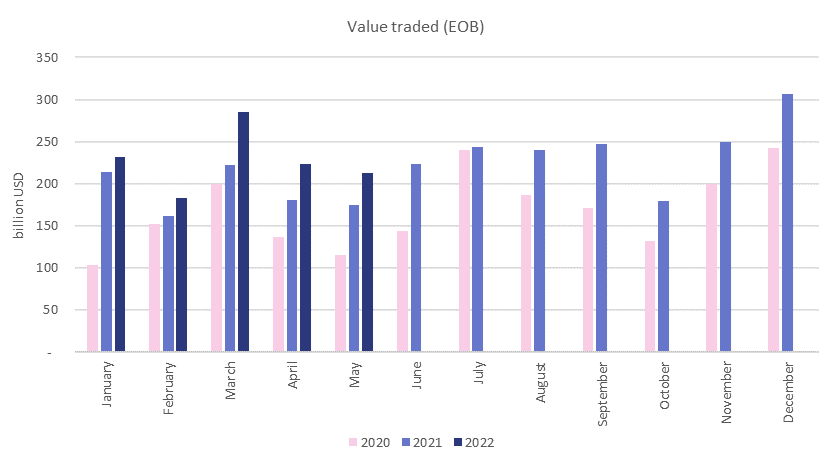
Figure 7: Investment funds value traded negotiated deals between Jan 2020 – May 2022
