Commodity derivatives trends
In this article, we analyse the trends in commodity derivatives (both options and futures) volumes (measured by the number of traded contracts) observed in the last year. Such an analysis could inform us about the production activities around the globe, as commodities serve as important input materials for productions, and producers could use commodity derivatives to manage risk associated with raw material price movements. The data is available on the WFE Statistics Portal, while the indicators are defined in our Definitions Manual. For questions or feedback about this article, please contact the WFE Statistics Team at [email protected].
The number of commodity derivatives contracts traded in Q4 2022 was 2.28 billion, which was a 4.4% decrease on Q3 2022 and a 14% fall on Q4 2021.
Commodity derivatives represent 9.8% of all derivatives contracts traded. Most of them are traded in APAC (81.5%), while 10.5% are traded in the Americas and 7.8% in the EMEA region.
Commodity futures accounted for 91% of the commodity derivatives, while options only for 9%.
Figure 1: Number of commodity derivatives contracts traded between Jan 2021 - Dec 2022
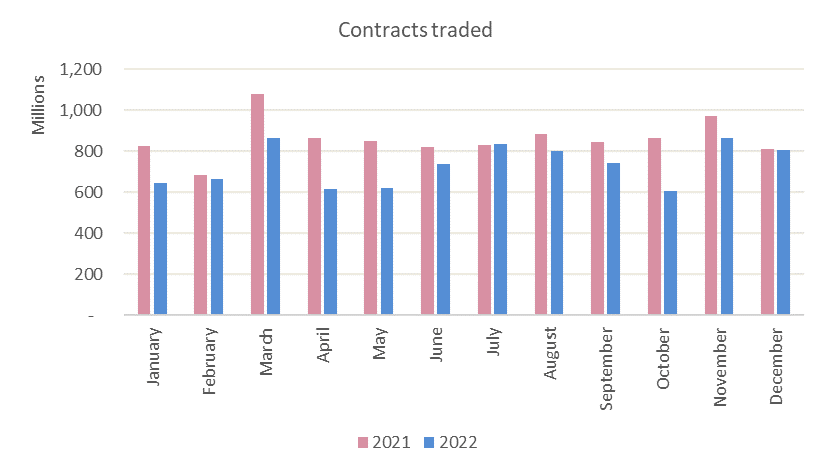
Figure 2: Number of commodity futures contracts traded between Jan 2021 - Dec 2022
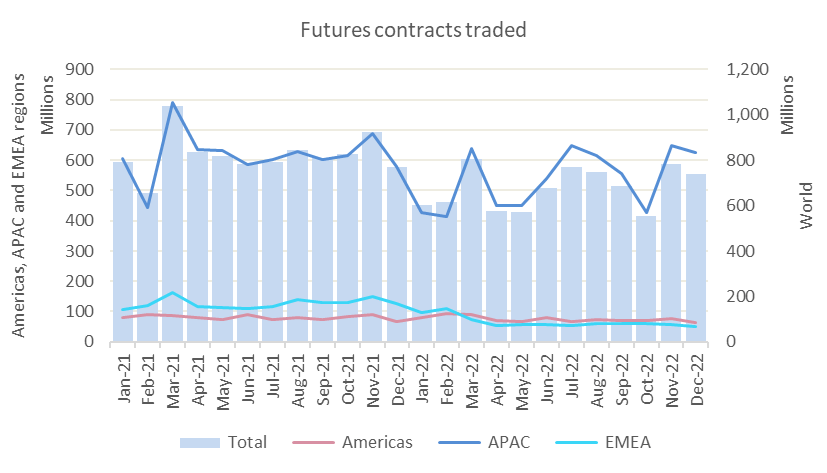
Figure 3: Number of commodity options contracts traded between Jan 2021 - Dec 2022
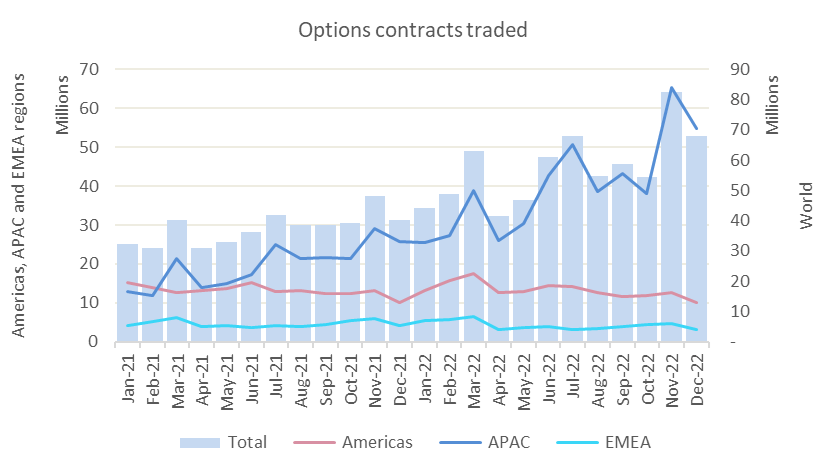
Quarter-on-quarter, in Q4 2022 futures volumes declined 5.9%, caused by a decline across all regions: the Americas 1.3%, APAC 6.5% and EMEA 4.3%, while the options went up 13%, due to the APAC and EMEA regions increasing 19.3% and 18.2%, respectively, while the Americas declined 10.1%.
In H2 2022 the volumes of commodity derivatives went up 12.3%, with both options and futures recording increases of 26.4% (amounting to 386.2 million) and 11.2% (4.28 billion), respectively, when compared to H1 2022. This result was entirely due to the APAC region, while the Americas and EMEA regions volumes declined.
In 2022 volumes fell 14.8% compared to 2021, due to the futures decreasing 17.9% (to 8.1 billion), while the options increased 53.8% (to 691.9 million).
The decrease in number of futures contracts traded in 2022 was caused by a decline in every region: the Americas 6.9%, APAC 13.1% and EMEA region 48.1%. Despite the regional outcome, some exchanges had a good year: Dubai Gold and Commodities Exchange which went up 53.3%, Hong Kong Exchanges and Clearing (up 49.2%), Matba Rofex (up 42.3%) and Singapore Exchange (up 27.6%).
The year-on-year increase in the volume of options in 2022 was mostly due to the APAC region going up 103.4%. Exchanges with an excellent performance were: Multi Commodity Exchange of India (402.6%), Zhengzhou Commodity Exchange (95%), Dalian Commodity Exchange (74.6%), Shanghai Futures Exchange (58.7%) and Singapore Exchange (54.1%).
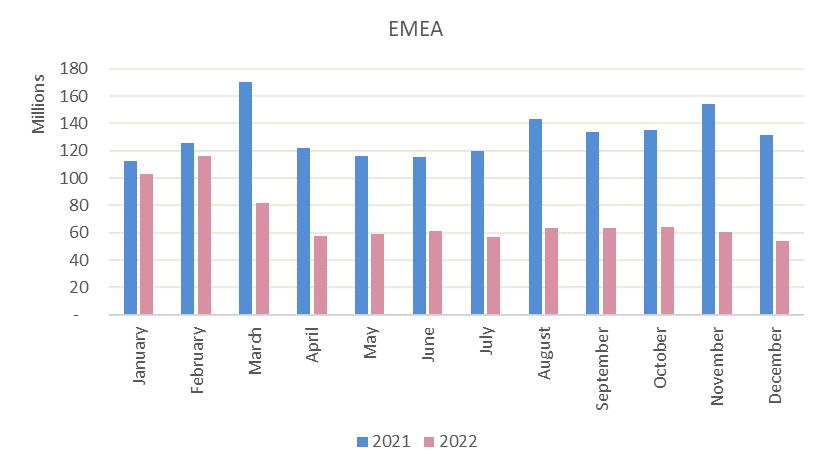
The number of commodity derivatives traded in each region is illustrated in Figures 4-6.
Figure 4: Number of commodity derivatives contracts traded in the Americas region between Jan 2021 - Dec 2022
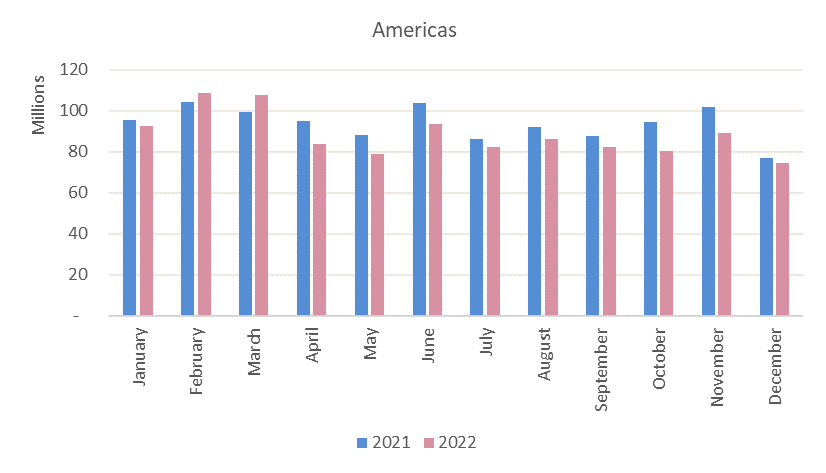
Figure 5: Number of commodity derivatives contracts traded in APAC region between Jan 2021 - Dec 2022
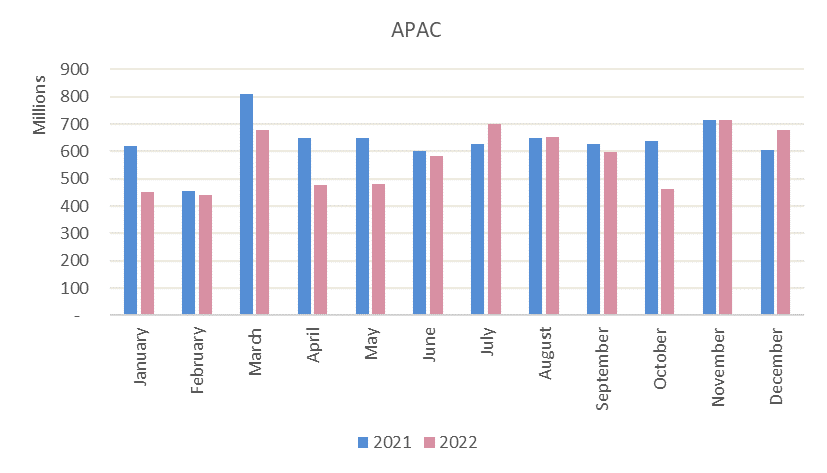
Figure 6: Number of commodity derivatives contracts traded in EMEA region between Jan 2021 - Dec 2022
