Currency derivatives trends
In this article, we analyse the trends in currency derivatives (both options and futures) volumes (measured by the number of traded contracts) observed in the last year. The data is available on the WFE Statistics Portal, while the indicators are defined in our Definitions Manual. For questions or feedback about this article, please contact the WFE Statistics Team at [email protected].
The number of currency derivatives contracts traded in Q4 2022 was 1.95 billion, which represented a 7.2% increase on Q3 2022 and 47.7% increase on Q4 2021 (Figure 1).
Currency derivatives represent 8% of all derivatives contracts traded. Most of them are traded in the APAC region (71.3%), while 16.9% are traded in the Americas and the rest 11.8% in EMEA region.
Currency options and futures are fairly equally split: 46% share and 54%, respectively (Figures 2 and 3). Currency options are almost entirely traded in APAC region (98% share), while currency futures are more equally split between regions: the Americas (36%), APAC (39%) and the EMEA region accounting for the rest (24%).
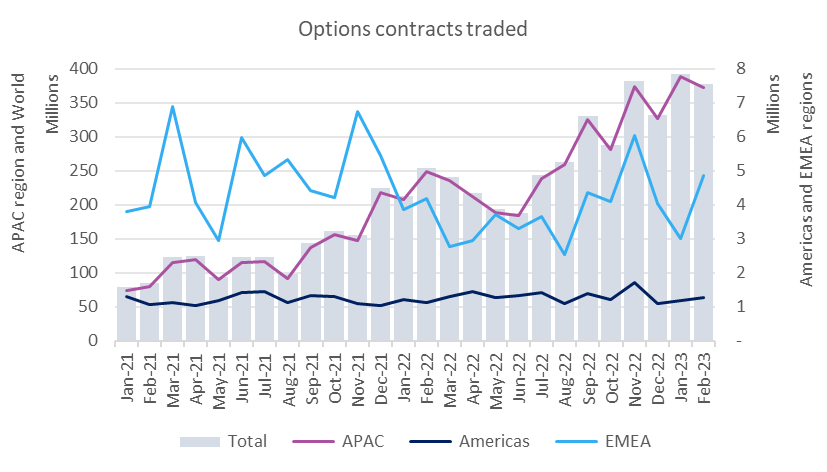
Figure 1: Number of currency derivatives contracts traded between Jan 2021 - Feb 2023

Figure 2: Number of currency futures contracts traded between Jan 2021 - Feb 2023

Figure 3: Number of currency options contracts traded between Jan 2021 - Feb 2023
Quarter-on-quarter, in Q4 2022 volumes of derivatives went up 7.2%, due to options which rose 19.4%, with all regions going up: the Americas 2.4%, APAC 19.3% and EMEA 34.4%, while futures fell 3.3%, due to the Americas and EMEA regions declining 13% and 12%, respectively, while the APAC region increased 12.8%.
In H2 2022 the volumes of derivatives went up 24.1%, when compared to H1 2022, with both options and futures recording increases of 40.8% (amounting to 1.84 billion contracts traded) and 11.4% (1.93 billion), respectively. This result was due to all regions recording rising volumes.
In 2022 48.4% more contracts were traded compared to 2021, due to both options and futures going up 104.9% (to 3.14 billion) and 19.9% (to 3.65 billion), respectively. This result was due to the Americas and APAC regions, while EMEA declined for both options and futures.
Exchanges with an excellent annual performance for futures contracts traded in 2022 were CME Group which went up 23.5% and Korea Exchange (up 27.1%), while for options contracts traded: CME Group (14.6%).
The number of currency derivatives traded in each region is illustrated in Figures 4-6.
Figure 4: Number of currency derivatives contracts traded in the Americas region between Jan 2021 - Feb 2023
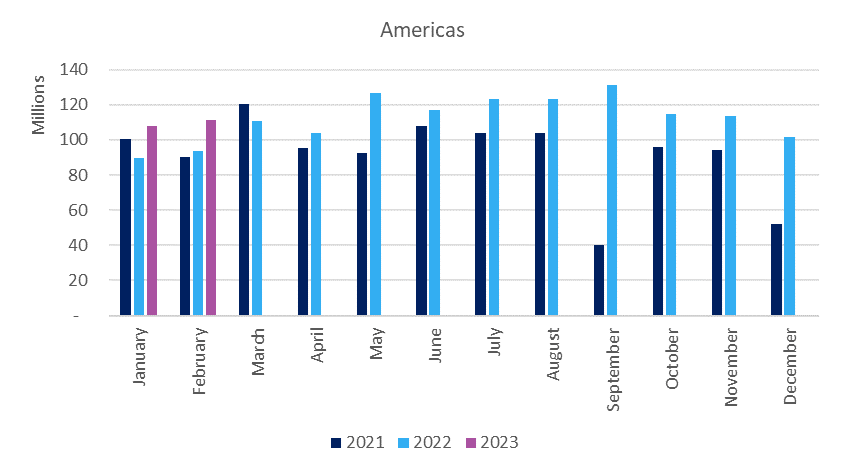
Figure 5: Number of currency derivatives contracts traded in APAC region between Jan 2021 - Feb 2023

Figure 6: Number of currency derivatives contracts traded in EMEA region between Jan 2021 - Feb 2023